MapStructure Debugger
| This article is a stub. You can help the wiki by expanding it. |
 | |
| Started in | 03/2014 (FGPlot) |
|---|---|
| Description | MapStructure Debugger |
| Maintainer(s) | Hooray |
| Contributor(s) | Hooray (since 03/2013) |
| Status | Proof-of-Concept |
| Topic branches: | |
| fgdata | canvas-hackers team clone (topics/canvas-radar) |
| Subforum | http://forum.flightgear.org/viewforum.php?f=71 |
| The FlightGear forum has a subforum related to: Canvas |
Objective
Developing new mapping/charting displays in FlightGear has never been so easy, thanks to Canvas, MapStructure and -of course- Nasal scripting.
However, due to the sophisticated nature of the MapStructure framework which now handles many advanced things transparently (such as e.g. caching of instanced symbols, but also positioned queries), it may be difficult at times to understand what exactly is going on behind the scenes, i.e. in terms of performance - to see where time is spent and what is done. The MapStructure debugger is intended to help exactly with this - it can be used to visualize performance of each layer by plotting graphs, to quickly find potential hot spots by looking right "under the hood".
The primary idea is to provide a solid foundation for people to maintain existing MapStructure layers, but also develop new ones from scratch - without having to be expert programmers, and without having to be intimately familiar with Nasal scripting or the Canvas system.
To help people use MapStructure, we need to make sure that certain conditions are met:
- well-commented source code
- good examples
- good tutorials and docs
- good diagnostics (warnings/error messages)
- good performance
- good tools/support
The MapStructure debugger will hopefully help with the last 3 of these.
Background
Note Contributors wanting to check out the topics/canvas-radar fgdata branch, need to follow these 3 steps:
This will give you a local branch named canvas-radar, so that you can easily pull/push changes. When pulling, it makes sense to pull with --rebase. The dialog can be found in the debug menu (MapStructure). |
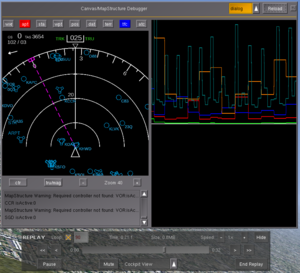
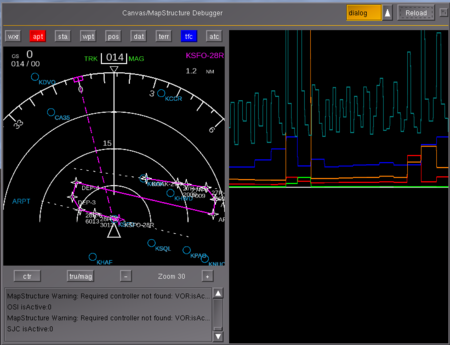
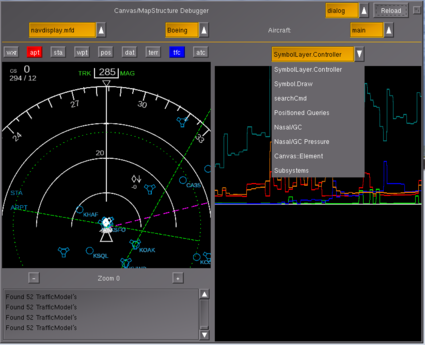
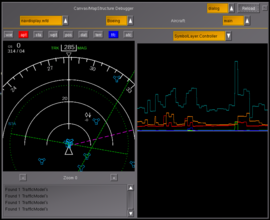
The MapStructure debugger is a simple GUI dialog intended to be used for debugging and benchmarking MapStructure-based charting layers. In its current form, it simply shows a NavDisplay inside the dialog with several layers enabled, including a 2D graph to benchmark each individual layer (such as APT, DME, FIX, TFC).
Currently, the dialog is fairly simple and pretty crude, the plotting code is entirely based on FGPlot and needs to be further generalized eventually (see Canvas Plotting Framework). However, so far it's actually working nicely and can help determine where time is spent, i.e. which layers are "expensive" compared to others.
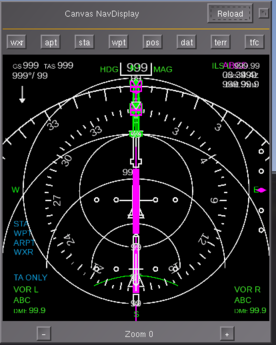
In addition, the MapStructure debugger dialog can be used to easily test MapStructure-based maps/charts like Gijs' NavDisplay, without having to start up a complex aircraft like the 747-400 or 777-200ER. In other words, the ND can be easily tested by using the ufo or ogeL - which are usually up and running within ~10 seconds.
This also makes it possible to easily conduct mostly automated test flights by using the Instant Replay and flight recorder features.
One added advantage here is that the GUI/dialog-centric approach lends itself to support rapid prototyping, because GUI dialogs can be easily reloaded from disk, without having to reset/exit/restart FlightGear to apply changes.
Currently, this is specific to Nasal code inside the dialog itself - but we're hoping to extend this further to also allow other files to be reloaded, such as:
- MapStructure layers
- MapStructure itself
- canvas APIs
Furthermore, the generic and decoupled approach encouraged by Canvas/MapStructure makes it possible for aircraft developers to prototype new functionality in a completely aircraft-agnostic fashion - so that the resulting work can later on be easily integrated/reused in other aircraft, but also in other GUI dialogs.
So people wanting to develop new mapping displays/layers will probably want to use this dialog, and extend it accordingly.
The main idea is that people should be able to select a "driver" (data source) for the instrument, such as the main aircraft or AI/MP traffic, and interact with the instruments using standard GUI widgets - rather than having to be familiar with a certain cockpit.
Currently, the focus is primarily to help with these efforts:
- CanvasMFD (F-JYL)
- Canvas ND Framework (Gijs, Hyde)
- Canvas PFD Framework (Gijs/Hyde)
- MapStructure itself obviously (Philosopher & Hooray)
Gallery
Development
The whole thing is a static PUI/XML dialog with several embedded Canvas widgets and Nasal sections to animate each embedded Canvas accordingly. There are quite a few features that are just "stubs" currently - but eventually, we'll hope to extend this a little more, some possible features would be:
- colorize each layer button according to the color of the plot
 Not done
 - provide an option to disable plotting
 Not done
 - fix up the FGPlot code to support dialog reloading (use maketimer and classes)
 Not done
 - show callback overhead (listeners and timers)
- also plot frame spacing & frame rate
- add more profiling hooks, beyond just SymbolLayer.Controller
Some other ideas are:
- support other *.mfd files (think pfd/eicas/efb etc)
- integrate this with F-JYL's MFD framework, including unit testing
- show number of instructions per layer (setprop/set/props)
- add markers/events, i.e. for onAdded/onRemoved such as +5/-8
- generalize the fgplot routines and turn them into a PropertyPlotter class
- support additional plots/styles
- add support for loading more "skins" (symbols sets and styles)
- integrate with route manager/flight recorder so that test flights can be more easily scripted without requiring user interaction
- add a custom canvas-based loglist widget for MapStructure events
Feel free to add your own ideas/wishes here - while we may not implement each feature request, we can at least tell you how to implement new features.
