Howto:Adding a canvas to a GUI dialog
| The FlightGear forum has a subforum related to: Canvas |
| Note This tutorial describes features only available in FlightGear >= 2.8 ! (also note that the Canvas/PUI support described here will eventually be phased out, once PUI is finally retired, probably some time after the 3.0 release). Also, please keep in mind that there some restrictions apply with regard to Canvas/Event handling in PUI dialogs. |
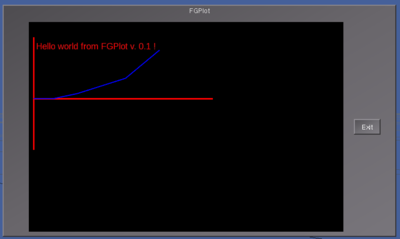
Using the combination of Nasal scripting, GUI dialogs and embedded canvas regions for 2D rendering, you can create standalone "FlightGear applications" in the form of self-contained dialogs that you can easily share with fellow FlightGear users. This can for example be used to create a plotting application like FGPlot, which would look to FlightGear like a conventional dialog.
To create a new canvas dialog, you can just open an existing dialog from $FG_ROOT/gui/dialogs (e.e.g copy a simple dialog like the exit/about dialog), and then customize it according to your needs - i.e. by naming it "fgplot.xml", remove any stuff that you don't need, then add a new canvas widget to the dialog, like this:
<canvas>
  <name>fgplot</name>
  <valign>fill</valign>
  <halign>fill</halign>
  <stretch>true</stretch>
  <pref-width>600</pref-width>
  <pref-height>400</pref-height>
  <nasal>
  <!--
       this is the Canvas-specific Nasal section where you can run your own Nasal code
       to access the canvas region
  -->
    <load>
      <![CDATA[

               # you can add your canvas-specific code here
               var my_canvas = canvas.get( cmdarg() ); # this will get a handle to the parent canvas :

               print("Hello world from the embedded canvas section!\n");

      ]]>
    </load>
  </nasal>
</canvas>
You can then use Nasal to animate your canvas and draw graphics etc.
FGPlot
Here's a complete fgplot.xml example for $FG_ROOT/gui/dialogs, open it through the Nasal console, by running gui.showDialog("fgplot");
(Note: As of 07/2013, FGPlot has significantly progressed since the early days of the prototype - see the FGPlot article for details and screen shots)
<?xml version="1.0"?>
<PropertyList>
  <name>fgplot</name>
  <modal>false</modal>
  <layout>vbox</layout>

  <text>
    <label>FGPlot</label>
  </text>

  <group>
    <layout>hbox</layout>
    <halign>fill</halign>
    <default-padding>10</default-padding>
    <empty><stretch>true</stretch></empty>

    <empty><stretch>true</stretch></empty>

    <canvas>
      <name>fgplot</name>
      <valign>fill</valign>
      <halign>fill</halign>
      <stretch>true</stretch>
      <pref-width>600</pref-width>
      <pref-height>400</pref-height>
      <nasal>
      <!--
           this is the Nasal/canvas section where you can run your own Nasal code
           to access the canvas section
      -->
        <load>
          <![CDATA[
                   # you can add your canvas-specific code here
                   var my_canvas = canvas.get( cmdarg() ); # this will get a handle to the parent canvas:

                   var root = my_canvas.createGroup();
                   var text = root.createChild("text")
                                  .setText("Hello world from FGPlot v. 0.1 !")
                                  .setTranslation(10, 30)
                                  .setAlignment("left-top")
                                  .setFontSize(20)
                                  .setFont("LiberationFonts/LiberationSans-Regular.ttf")
                                  .set("max-width", 380)
                                  .setColor(1,0,0);


                   var graph = root.createChild("group");

                   var x_axis = graph.createChild("path", "x-axis")
                                     .moveTo(10, 150)
                                     .lineTo(380, 150)
                                     .setColor(1,0,0)
                                     .setStrokeLineWidth(3);

                   var y_axis = graph.createChild("path", "y-axis")
                                     .moveTo(10, 30)
                                     .lineTo(10, 250)
                                     .setColor(1,0,0)
                                     .setStrokeLineWidth(3);

                   var plot = graph.createChild("path", "data")
                                   .setStrokeLineWidth(2)
                                   .setColor(0,0,1)
                                   .moveTo(10,150); # origin

                   var samples = [ # absolute coordinates
                                   [50, 150], [100,140], [200,110], [270, 55]
                                 ];

                   foreach(var set; samples) {
                                               plot.lineTo( set[0], set[1] );
                   }
          ]]>
        </load>
      </nasal>
    </canvas>

    <button>
      <legend>Exit</legend>
      <equal>true</equal>
      <key>Esc</key>
      <binding>
        <command>dialog-close</command>
      </binding>
    </button>

    <empty><stretch>true</stretch></empty>
  </group>
</PropertyList>
Next, you can use a timer to plot properties like /position/altitude-ft or /velocities/groundspeed-kt.
