How to manipulate Canvas elements
| The FlightGear forum has a subforum related to: Canvas |
The purpose of this document is to introduce the plot2D tool and provide basic information about its use.
Plot2D is nothing more than a collection of helpers that aims to facilitate the task of coding. It makes intensive use of the Canvas API, a mandatory reference for those who intend to refine the result beyond what is offered by plot2D.
It is assumed here that you already have a minimal knowledge about Canvas.
For now, Plot2D resides in the SpokenGCA addon, but the idea is that in the future it could be included in the $FG-ROOT/Nasal/canvas directory.
If you have not the SpokenGCA addon installed, you may download plot2D.nas from here, put it into your $FG-HOME/Nasal/ folder and then execute:
  var home = getprop("/sim/fg-home");
  io.load_nasal( home ~ '/Nasal/plot2D.nas', "canvas" );
Once executed, you can try the examples given below.
Create helpers
line
Parameters: (group, from, to, color="#0")
Plots a line as <group>'s child.
- from as [x,y] in pixels.
- to as [x,y] in pixels.
- color optional as [r,g,b] or "#rrggbb", Black by default.
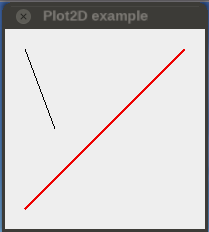
| example | Screenshot |
|---|---|
var window = canvas.Window.new([200,200],"dialog")
    .set("title","Plot2D demo"  );
var myCanvas = window.createCanvas()
    .set("background", "#eeeeee");
var root = myCanvas.createGroup();
var myGroup = root.createChild("group");
canvas.plot2D.line(myGroup,[20,20],[50,100]);
canvas.plot2D.line(myGroup,[20,180],[180,20],'#ee0000')
.setStrokeLineWidth(2); |
hzLine
Parameters: (group, from, length, color="#0")
Plots an horizontal line as <group>'s child.
- from as [x,y] in pixels.
- length in pixels.
- color optional as [r,g,b] or "#rrggbb". Black by default.
vtLine
Parameters: (group, from, length, color="#0")
Plots a vertical line as <group>'s child.
- from as [x,y] in pixels.
- length in pixels.
- color optional as [r,g,b] or "#rrggbb". Black by default.
dashedLine
Parameters: (group, from, to, dash=8, color="#0")
Plots a vertical line as <group>'s child.
- from as [x,y] in pixels.
- to as [x,y] in pixels.
- dash optional dash&space lengths in pixels, 8 pixels by default.
- color optional as [r,g,b] or "#rrggbb". Black by default.
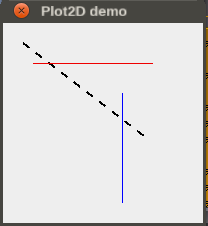
| example | Screenshot |
|---|---|
var window = canvas.Window.new([200,200],"dialog").set("title","Plot2D demo"  );
var myCanvas = window.createCanvas().set("background", "#eeeeee");
var root = myCanvas.createGroup();
var myGroup = root.createChild("group");
canvas.plot2D.dashedLine(myGroup,[20,20],[150,120]).setStrokeLineWidth(2);
var (red,blue) = ['#ee0000', [0,0,1] ];
canvas.plot2D.hzLine(myGroup,[30,40],120,red);
canvas.plot2D.vtLine(myGroup,[120,180],-110,blue); |
rectangle
Parameters: (group, size ,origin=nil, color="#0", fill=nil, rounded=nil)
Plots a rectangle as <group>'s child.
- size as [width,height] in pixels.
- origin optional as [x,y] in pixels, [0,0] by default.
- color optional border color as [r,g,b] or "#rrggbb" or nil (for no border). Black by default.
- fill optional fill color as [r,g,b] or "#rrggbb", No filled by default.
- rounded optional corner radius in pixels, Not rounded by default.
grid
Parameters: (group, size, dx, dy, origin=nil, color="#0", border=1)
Plots a grid as <group>'s child.
- size as [width,height] in pixels.
- dx tiles width in pixels.
- dy tiles height in pixels.
- color optional grid color as [r,g,b] or "#rrggbb". Black by default.
- origin optional as [x,y] in pixels, [0,0] by default.
- border optional as boolean, True by default.
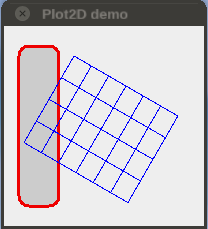
| example | Screenshot |
|---|---|
var window = canvas.Window.new([200,200],"dialog").set("title","Plot2D demo"  );
var myCanvas = window.createCanvas().set("background", "#eeeeee");
var root = myCanvas.createGroup();
var myGroup = root.createChild("group");
var (red,blue,grey) = ['#ee0000', [0,0,1], [.8,.8,.8] ];
  ## Note: to eventually handle an element, you must assign a variable:
var myRect = canvas.plot2D.rectangle(myGroup,[40,160],[15,20],red,grey,10);
myRect.setStrokeLineWidth(3);
canvas.plot2D.grid(myGroup,[120,100],20,25,[70,30],blue).setRotation(30*D2R); |
text
parameters: (group, text, origin=nil, size=nil, color="#0", align="left-baseline")
Plots a text as <group>'s child.
- text the text itself as string.
- origin optional as [x,y] in pixels, [0,0] by default.
- size optional font size and aspect as [<size-px>,<height/width>]. [11,1] by default.
- color optional font color as [r,g,b] or "#rrggbb". Black by default.
- align optional origin reference. "left-baseline" by default.
polyline
parameters: (group, xSet, ySet, color="#0", symmetrical=' ')
Plots a polyLine as <group>'s child.
- xSet as [x0,...,xn] in pixels.
- ySet as [y0,...,yn] in pixels.
- color optional grid color as [r,g,b] or "#rrggbb". Black by default.
- symmetrical optional string, may be 'x', 'y', 'xy' or 'yx'. Non symmetrical by default.
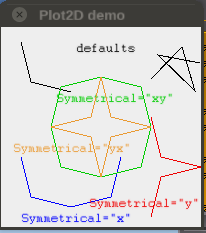
| example | Screenshot | |
|---|---|---|
var (red,blue,green,orange) = ['#ee0000', [0,0,1], [0,0.8,0], '#ea9a32' ];
canvas.plot2D.polyline(myGroup,[150,181,194,157,199],[52,20,64,28,36]);
   ## 3 vertices with default values:
canvas.plot2D.polyline(myGroup,[20,30,70],[15,55,65]);
canvas.plot2D.text(myGroup,'defaults',[75,25]);
   ## 3 vertices with symmetrical = 'x':
canvas.plot2D.polyline(myGroup,[20,30,70],[130,170,180],blue,"x");
canvas.plot2D.text(myGroup,'Symmetrical="x"',[20,195],,blue);
   ## 3 vertices with symmetrical = 'y':
canvas.plot2D.polyline(myGroup,[150,160,200],[90,130,140],red,"y");
canvas.plot2D.text(myGroup,'Symmetrical="y"',[198,180],,red,'right-baseline');
   ## 3 vertices with symmetrical = 'xy':
canvas.plot2D.polyline(myGroup,[50,60,100],[100,140,150],green,"xy");
canvas.plot2D.text(myGroup,'Symmetrical="xy"',[55,75],,green);
   ## 3 vertices with symmetrical = 'yx':
canvas.plot2D.polyline(myGroup,[100,110,150],[50,90,100],orange,"yx");
canvas.plot2D.text(myGroup,'Symmetrical="yx"',[12,125],,orange); |
graphic
parameters: (group, ySet, dx=nil, origin=nil, color="#0"
Plots the curve sampled in <ySet> with a resolution of <dx>.
- ySet as [y0,...,yn] in pixels.
- dx optional curve resolution in pixels. 1 px by default.
- origin optional as [x,y] in pixels, [0,0] by default.
- color optional grid color as [r,g,b] or "#rrggbb". Black by default.
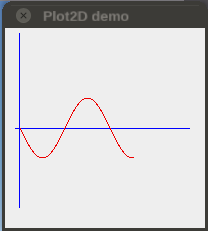
| example | Screenshot | |
|---|---|---|
  var (red,blue,green,orange) = ['#ee0000', [0,0,1], [0,0.8,0], '#ea9a32' ];
  var yValues = [];
  for(var i=0;i<460;i+=4) append(yValues, 30*math.sin(i*D2R));
  canvas.plot2D.hzLine(myGroup, [10,100],175,blue);
  canvas.plot2D.vtLine(myGroup, [15,180],-175,blue);
canvas.plot2D.graphic(myGroup, yValues,,[15,100],red); |
Movement helpers
flipX
parameters: (elem, Xaxis=0)
Flips horizontally the element.
- elem element to be flipped.
- Xaxis optional abscissa of the symmetry axis . If 0 (default) element flips in-place.
flipY
parameters: (elem, Yaxis=0)
Flips vertically the element.
- elem element to be flipped.
- Yaxis optional ordenate of the symmetry axis . If 0 (default) element flips in-place.
rotate180
parameters: (elem, center=nil)
Rotates the element 180 deg around center.
- elem element to be rotated.
- center optional as [Cx,Cy] in pixels. Rotates in-place by default.
alignX
parameters: (elem, ref, alignment)
Aligns the element, moving it horizontaly to ref.
- elem element to be moved.
- ref reference may be an integer or another element.
- alignment as string: may be 'left-left', 'left-center', 'left-right',
'center-left', 'center-center', 'center-right',
'right-left', 'right-center', or 'right-right'.
If ref is a single number, the 2nd word is ignored.
alignY
parameters: (elem, ref, alignment)
Aligns the element, moving it vertically to ref.
- elem element to be moved.
- ref reference may be an integer or another element.
- alignment as string: may be top-top', 'top-center', 'top-bottom',
'center-top', 'center-center', 'center-bottom',
'bottom-top', 'bottom-center', or 'bottom-bottom'.
Text elements also accept 'baseline' as reference.
If ref is a single number, the 2nd word is ignored.
Resize helpers
stretchX
parameters: (elem, factor, ref='left')
Stretchs horizontally the element .
- elem element to be stretched.
- factor the <new-width>/<old-width> ratio.
- ref optional: the relative point to keep inplace. May be 'left' (default),'center' or 'right'.
stretchY
parameters: (elem,factor,ref='top')
Stretchs vertically the element .
- elem element to be stretched.
- factor tthe <new-height>/<old-height> ratio.
- ref optional: the relative point to keep in-place. May be 'top' (default),'center' or 'bottom'.
resize
parameters: (elem,factors,ref='left-top')
Resizes vertically the element along both X and Y axis.
- elem element to be resized.
- factors as [Xfactor, Yfactor].
- ref optional: the relative point to keep in-place, as string. May be left-top', 'left-center', 'left-bottom',
'center-top', 'center-center', 'center-bottom',
'right-top', 'right-center', or 'right-bottom'.
Behind the scenes
Let's see in detail the elements Canvas.
Open the Interactive Nasal REPL interpreter and execute (you can copy&paste, then ↵ Enter:
var window = canvas.Window.new([300,200],"dialog").set("title","Plot2D demo"  );
var myCanvas = window.createCanvas().set("background", "#eeeeee");
var root = myCanvas.createGroup();
var myGroup = root.createChild("group");
We have our new canvas, ready to play with.
At the >>> prompt type:
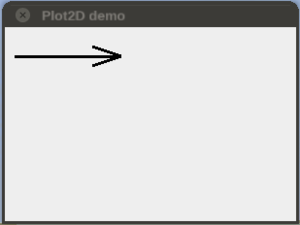
var arrow = canvas.plot2D.polyline(myGroup,[90,120,10],[20,30,30],'#0',"y");Do not forget the ↵ Enter.
You should have something like this:
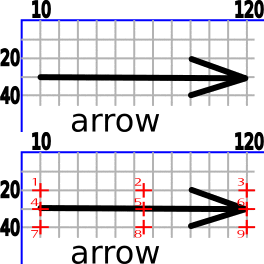
Let's get closer to see some hidden stuff:
Our arrow has (like any other element) its own intrinsic coordinate system.
Internal Coordinates
Typing:
arrow.getBoundingBox(); you get [9.5,19.5, 120.5,40.5] which are the values for [Xmin,Ymin, Xmax,Ymax].
The virtual points (the red flashing ones) are usually named as (from 1 to 9):
'left-top'     'center-top'     'right-top'
'left-center'  'center-center'  'right-center'
'left-bottom'  'center-bottom'  'right-bottom' Is nothing other than a convenient way to refer to (Xmin,Ymin), (xXmin+Xnax/2,Ymin), etc.
Plot2D (and Canvas API) uses such nomenclature.
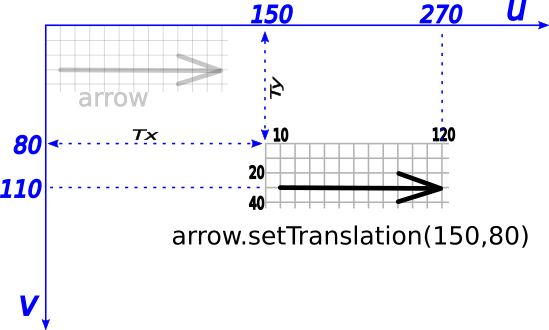
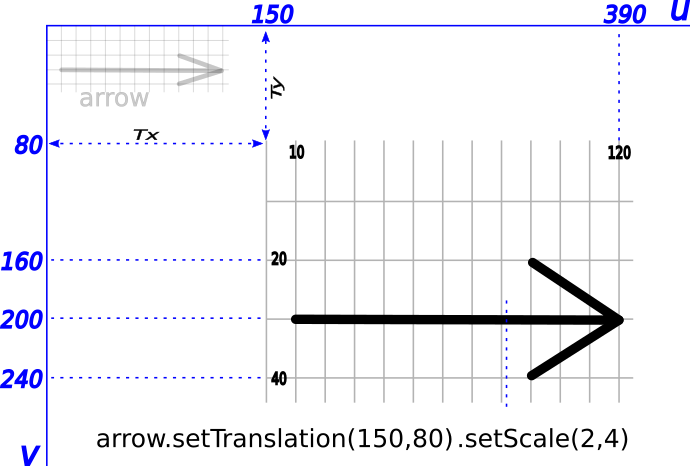
Let's apply a translation:
arrow.setTranslation(150, 80);The blue axis and labels are showing the ( u, v ) absolute coodinate system.
Note that the translated arrow has brought with him his intrinsic coordenate system and his BoundingBox remains unchanged.
Calling the getTranslation() we get [Tx, Ty] (In our case [150, 80] ).
All points of the element meet the following equations::
u = Tx + x
v = Ty + y
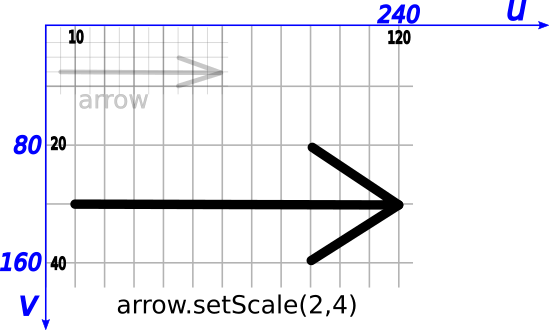
In a similar way, scaling works. Type:
arrow.setTranslation(0,0);
arrow.setScale(2,4);
arrow.getScale();
you get [2,4] which are the values for [Sx, Sy].
Again, the BoundingBox and the intrinsic coordenate system remains unchanged.
Fundamental Equations
Now the general case, applying both Translation and Scaling:
arrow.setTranslation(150,80);
arrow.setScale(2,4);
The Fundamental Equations:
u = Tx + x * Sx
v = Ty + y * Sy
                            and his reciprocals:
Tx =  u - x * Sx
Ty =  v - y * Sy
Plot2D makes extensive use of these equations.
