Hackathon Proposal:Nasal GC Inspection
| I noticed a lot of stuttering and frame rate which with regular pattern was going from 30/40ms to almost 1 second. I switched off WS3.0 and the situation is better, but still I can see stutters. |
| The jitters/stutters are almost certainly a separate issue, most likely Nasal garbage collection. |
| Title: | Nasal Garbage Collection Inspection
| |||
| Potential mentors: | Richard Harrison, James Turner | |||
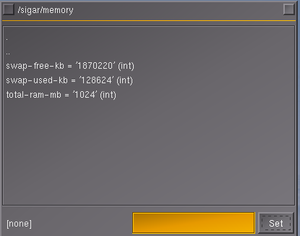
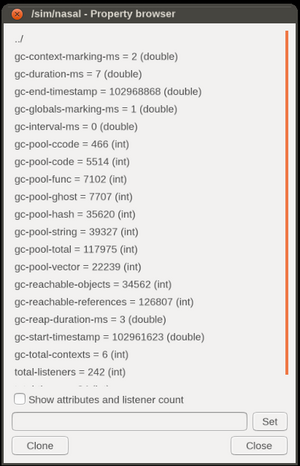
| Intro: | 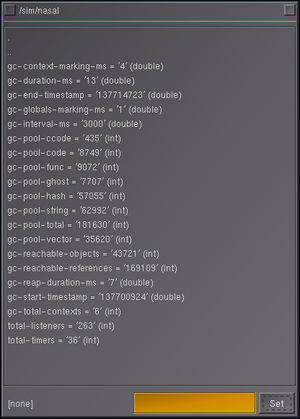 Old PUI dialog showing the Property browser in a custom SG/FG build that exposes Nasal internals via the fgfs property tree (listeners, timers and Nasal GC info) FlightGear's garbage collector The jitter/stuttering is caused by Nasal's "garbageCollect" method. Simple test: add a printf (apply attached "patch" to simgear) and you should see the "stutter" is synchronized with it. The garbage collector does a complete scan of all Nasal objects to detect and remove unreachable elements. So, the more Nasal data elements we have, the worse the jitter gets. Large Nasal data structures will eventually break every CPU. And since it's done in the context of normal Nasal calls, and not in a separate background thread, it directly affects the duration of our main update loop - hence frame rate. Not so nice.[4] The event manager handles timers, and that's almost exclusively used by Nasal. Almost all the Nasal code runs in timers (except for property listeners). So read "events" as the total execution time for Nasal (timers). The timing data shown for the subsystem "nasal" only refers to the execution time of Nasal internal house keeping (i.e. some garbage collection), but not to the execution of actual Nasal code. Indeed misleading.[5] | |||
| Interested Parties: | please add yourself if you are interested in working on this | |||
| Status: | RFC | |||
| Summary: | See also Nasal GC Musings.
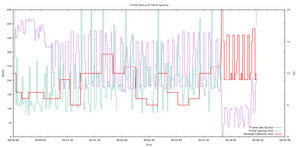
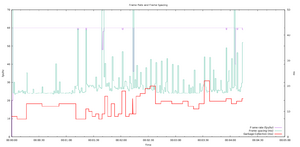
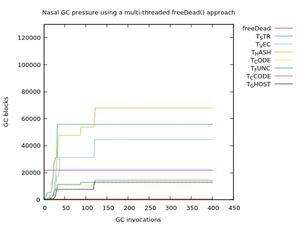
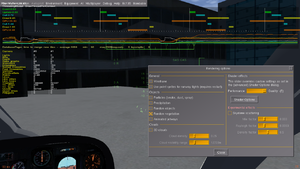
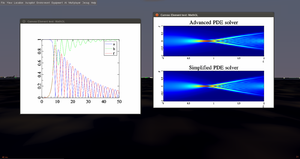
GC stuttering can be seen when using Nasal heavy features, like the FG1000.  nvidia nsight showing fgfs (Minimal Startup Profile, no scenery, with all Draw masks set), just running the FG1000 without PUI 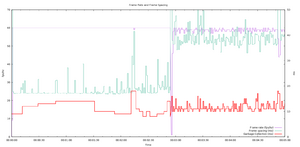 Screen shot showing a diagram created with gnuplot to visualize the relationship between frame rate, frame spacing and GC induced pauses (exemplified by opening the FG1000 at ~ 03:00) - this causes a ton of GC pressure, and ends up running the GC more frequently than before | |||
| Background: | frame stuttering definitely happens for me, a pause of anything between 20 to 50ms every time the current GC is invoked. I've timed this in the C++ and the values (for the F-15 are in the table below). The main loop has to waits for this so it definitely happens. The time taken will vary with CPU, the measurements below were taken with i7-4790k, 24gb RAM, R9-290 average msec 24.65 max 45.349 min 1.488 The claim isn't hard to solidify - I've measured it using high resolution timers; however I accept that it might be hard to perceive; and doesn't affect Nasal that is coded to avoid GC (either using a lot of globals or being careful about local variables) Fly low and fast in the F-15 and look out of the side window (high zoom level makes it more apparent).[6] | |||
| Details: |
| |||
| Ideas: | At some point in the future, the Nasal runtime would benefit from being upgraded with a concurrent and perhaps parallel garbage collector. The current stop-the-(Nasal)-world GC may inflict long delays in the simulation main loop.
For the time being, it would be a good idea to provide options to disable Nasal entirely, and/or the GC itself, so that people can better identify/track Nasal related issues. Several years ago, ThorstenB provided patches that dumped some GC internals to the console (see [1] and [2] ) - that work could be adapted and generalized to publish the same stats to the property tree. diff: Original Nasal GC patch
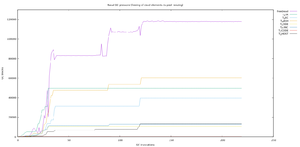
More recently, Richard H. added suppport for an experimental threaded GC (see SimGear commit 92a3c8b meanwhile reverted), those patches also included additional stats that could be enabled using preprocessor macros. In conjunction, these two patches could be used to "publish" the same stats at runtime in the property tree, possibly GC globals, but also per memory pool. That way, the built-in XML logging system could be used to dump GC stats to an XML file for later evaluation. Also, another possibility would be to visualize GC stats using the Canvas system (via plotting). Alternatively, a gnuplot file could be created to visualize GC stats using gnuplot. Another idea would be hooking up these properties to the built-in on-screen OSG stats: Extend FGStatsHandler to expose Nasal GC stats via osg::StatsHandler
| |||
| Required skills: | Property tree, PropertyList XML File, Nasal, Canvas, Timers, Listeners | |||
| Learning Opportunities: |
| |||
| Notes: |
