Icaro Laminar 13 MRX
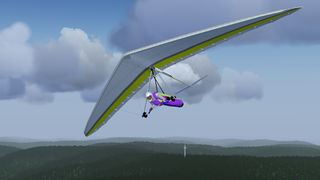
.jpeg) Soaring over Nordkette/Innsbruck (near LOWI) | |
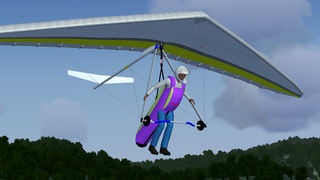
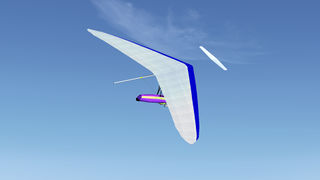
.jpeg) Ready for take off at Seegrube/Innsbruck (near LOWI) | |
| Type | Hang glider, Glider aircraft |
| Configuration | Delta-wing aircraft |
| Propulsion | Unpowered aircraft |
| Manufacturer | ICARO |
| Author(s) | D-NXKT |
| FDM | JSBSim |
| --aircraft= | Icaro_Laminar_13_MRX |
| Status | Production |
| FDM |
|
| Systems |
|
| Cockpit |
|
| Model |
|
| Development | |
| Website |
|
| Repository |
|
| Download |
|
| License | GPLv2+ |
|
| |
This model represents a Laminar 13 MRX hang glider build by ICARO in the early 2000s.
It is an advanced kingpostless hang glider which still represents the characteristical properties of a state of the art hang glider.
One aim of the development of this glider is rather to have a very realstic generic hang glider model than an exact copy of the Laminar 13. This means that some features and properties of this model can deviate from the real glider. However, since performance and flight dynamics don't differ so much between different hang gliders, the flight behavior should be very close to the real thing.
One more purpose of this model is to provide a tool that allows real hang glider pilots to exercise flight conditions that are way too dangerous to exercise in real life.
Features
- Weight-shift controlled
- VG (Variable Geometry)
- Semi flexible hang strap
- Realistic performance and stall behavior for all VG-settings
- Drag is dependent on pilot attitude (upright pilot and/or legs outside harness generates more drag)
- Tumble
- Spin
- Ground effect
- Impact of rain on performance and stall behavior
- Wing failure caused by aerodynamic overloading
- Drogue parachute
- Emergency parachute
- Horizontal stabilizer (optional and customizable)
- Vertical stabilizer (optional and customizable)
- Winch (incl. 2-stage release and step towing)
- Aerotowing
- Smoke system
- View of instantaneous flow vector, aerodynamic force vector and center of gravity location
- Gust generator (trigger a 1-cosine gust on demand). Gust strength, direction and duration are customizable.
- Drop test
- Flight recorder (incl. vector, c.g. and winch animation)
- Highly customizable (via GUI)
Upcoming features that will be released in 2025:
- Use of measured data from the test vehicle for realistic calculation of lift, drag, and aerodynamic moments
- Load-dependent pitch moment coefficients for more accurate flight behavior simulation
- Hands-free flying – important for trimming and tuck simulation
- Calculation of control forces – excessive forces may limit controllability
- Customizable sprog settings – to simulate the effects of washout angle adjustments on flight characteristics
- Improved spin entry with realistic spin dynamics (spin rate)
- User-defined position of the aerodynamic reference point for precise trim adjustments
Limitations
- Wing flexibility is not taken into account in detail.
- No interaction between towrope and glider frame
Recommended flying sites
A very beautiful site is the real life hang gliding launch "Seegrube" which is located near LOWI (--lon=11.379070 --lat=47.306263 --heading=155 --on-ground). Choose 15kt wind from 180deg for all altitudes and soar up to the summits.
External links
Some acro examples
- Acroproject (vimeo)
- A perfect day (youtube)
If things go wrong or the special flight dynamics of hang gliders
- A classical tumble (youtube)
- Wing failure (youtube)
- Spin, looping, tumble (youtube)
- Looping, tumble, ... 2 rescue chutes are not enough (youtube)
- Things become violent 1 - negative pitch divergence (youtube)
- Things become violent 2 - positive pitch divergence (youtube)
- Bad wingover (youtube)
- Loop goes wrong -> Tuck and Tumble (youtube)
- Negative spinning IS possible (youtube)
- Uncommanded roll into inverted flight (youtube)
- Turbulence (facebook)
FlightGear for Pilot Training
- (de) Using FlightGear in Hang Glider Training – A User Report
- Sample Video for Simulator Training (vimeo)
References
- (de) Schönherr, Michael, "Der Flattersturz" 1977-1979 (PDF, 60.1MB)
- (de) Schönherr, Michael, "Das Phänomen des Vorwärtsüberschlags" 1987-1988 (PDF, 10.5MB)
- (de) Nickel Karl, Wohlfahrt Michael, "Schwanzlose Flugzeuge: Ihre Auslegung und ihre Eigenschaften", Basel, Boston, Berlin, Birkhaeuser, 1990, ISBN 3-7643-2502-X
- I. Azaryev, "TUMBLE of a HANG GLIDER" (PDF, 0.4MB)
- (de) Altmann Horst, "Aeroelastoflexible Eigenschaften, Stabilität und Dynamik von Hängegleitern", Herbert Utz Verlag Wissenschaft, München, 1997, ISBN 3-89675-234-0
Related content
Gallery
Hang strap

Stabilizer
Optional and customizable horizontal stabilizer
Optional and customizable vertical stabilizer
T-tail configuration
Horizontal stabilizer in landing configuration
Canard configuration


.jpeg)


For nerds ... and hang glider pilots who want to survive this sport
This section will take a closer look at the special flight dynamics of hang gliders due to their weight-shift control and flexibility.
All the points described here can be tested and verified using the FlightGear hang glider Laminar 13 MRX. This should improve the understanding and might help to avoid extreme flight situations or to train safe recoveries from such situations.
As an introduction, reference is made to two threads in the German Hang Gliding Forum, in which the static and dynamic longitudinal stability of weight-shift controlled hang gliders is examined in more detail:
Das Momenten-Quiz
and
Einfluss von Böen auf Längsstabilität.
The aim is to present here the most important topics to a broader and international audience, or in short: to translate them into English.
Further discussions, comments, enhancements or amendments to the following can be made in the German Hang Glider Forum.
All contributions are more than welcome - also in English if you want.
Basics of pitching moment and longitudinal stability
The moment curve plays a central role in analyzing the static and dynamic longitudinal stability of an aircraft. It describes how the moment (i.e. the torque) acting on the aircraft varies with changes in the angle of attack and over time. Here are the key points about the moment curve and its importance:
- Definition of Moment: The moment is a measure of how a force causes an object to rotate around a pivot point (in this case, the aircraft’s center of gravity). In the context of static longitudinal stability, the moment refers to the pitching behavior of the aircraft.
- Moment Curve and Angle of Attack: The moment curve shows how the moment about the center of gravity of an aircraft varies as a function of the angle of attack (α). The angle of attack is the angle between the wing and the airflow. When the angle of attack changes, it affects the lift and the moment acting on the aircraft.
- Stability Criterion: An aircraft is statically stable if the moment about the center of gravity produces a negative value when the angle of attack increases (i.e., the moment acts against the deviation). Therefore, the moment curve should have a negative slope as the angle of attack increases up to a certain point. The steeper the negative gradient, the higher the restoring forces. The gradient of the moment curve is also known as the longitudinal stability margin.
In summary, the moment curve is an important tool for evaluating and understanding the static and dynamic longitudinal stability of an aircraft and how changes in the angle of attack affect its flight behavior.
In order to assess the longitudinal stability of hang gliders, it must first be clarified where the moment reference point for hang gliders actually is located. For conventional aircraft, it is the aircraft's center of gravity. Unfortunately, there are many different centers of gravity for weight-shift controlled hang gliders with flexible main suspension. The following slide provides an overview:

The diagram shows that the moment reference point can change considerably depending on the configuration. Basically, a distinction can be made between three different flight configurations:
Configuration 1 corresponds to the usual flight condition:
- hands are at the control bar
- main suspension is tight
The moment reference point is the overall center of gravity of the system consisting of the hang glider and the pilot (green triangle in the diagram ▲).
Configuration 2 corresponds to hands-free flying:
- no contact between pilot and base bar
- no contact from the pilot to any other part of the hang glider
- the only connection from the pilot to the glider is via the main suspension to the hang point (HP)
- tight (!) main suspension
For this configuration, the moment reference point is in the "common center of gravity of glider and pilot, whereby the entire pilot mass is to be assumed at the hang point" (green gradient symbol ▼). This point is much closer to the wing.
Comment: For this configuration only, it can be shown (e.g. Michael Schönherr, 1977-1979; Horst Altmann dissertation, 1997) that the (mathematically difficult to describe) 2-body hang glider-pilot system can be regarded as a 1-body system (simple mathematical description).
In configuration 3,
- the main suspension is loose and there is
- no contact between the pilot and the hang glider (pilot is falling aside the hang glider).
Consequently, the center of gravity of the hang glider (🟦) must be selected as the moment reference point. During this phase of flight, the hang glider does not even know that there is a pilot next to it. The hang glider must recover on its own. However, this flight condition usually only occurs for an extremely short time. The practical relevance is therefore low.
Another important moment reference point - although this is not a center of gravity - is the suspension point (HP) (🟠). The moment around this point describes the control forces.
In the prevailing discussions on longitudinal stability, these four moment reference points are often mistaken and mixed up in the argumentation.
Composition of the total moment
The total moment is made up of two parts. The first part is the moment of the wing, which is determined by the lift distribution and is usually given for a fixed reference point (on the following slide, for example, at the suspension point HP). This moment is mainly dependent on the angle of attack. It is a particular characteristic of the hang glider design and cannot be used for steering.
The second part of the total moment is generated by the aerodynamic force (lift and drag). It is caused by the moment arm (vertical distance from the direction of the aerodynamic force vector to the overall center of gravity). If the overall center of gravity is located behind the force vector, a positive moment (pitch-up) is generated; if the overall center of gravity is located in front of it, a negative moment (pitch-down) is the result. This is shown in the left-hand configuration. For the sake of clarity, however, only the contribution of lift to the total moment is shown here. The drag component has been omitted in the diagram.
This moment is not only dependent on the angle of attack (both lift and drag are growing with increasing AoA) but also to a significant extent on the length of the moment arm (brown dashed line in the diagram), i.e. the pilot's position/control deflection. This moment is therefore relevant for controlling the hang glider. Consequently, a non-zero aerodynamic force must be present to achieve a control effect. This is practically always the case. Only for the angle of attack at which the lift is zero no controlling is possible. This angle of attack is named α0.
For α>α0, the lift is always positive. The force points upwards and the steering effect is as described: the further the center of gravity moves backwards, the stronger the pitching-up moment, the further the CoG moves forwards, the stronger the pitching-down moment. The opposite applies for α<α0! Here there is downforce on the wing and the control effect is reversed (right-hand configuration in the slide). Now pushing out results in a pitch-down moment and pulling in causes a pitch-up moment.
The reversal of control effect at α0 is an inherent property of weight-shift controlled hang gliders. Understanding this principle is essential for safe flying. It must therefore be an integral part of hang glider instruction!
.jpg)
Moment coefficient versus absolute moment
The use of the moment coefficient instead of the absolute moment offers several advantages, including comparability, scalability, and simplified mathematical analyses. The moment coefficient allows for a better description of the aerodynamic properties and behavior of aircraft, making it an important tool in aerodynamics and aircraft design.
The moment coefficient is closely related to the lift coefficient and is often used to assess flight behavior. In particular, the moment coefficient describes how strongly an aircraft responds to a change in the angle of attack.
The moment coefficient is dimensionless. This makes it easier to compare the stability and behavior of different aircraft, regardless of their size or weight. The absolute moment, on the other hand, depends on specific units, which makes comparisons more difficult. The moment coefficient can be used under various flight conditions (such as speed and air density) to characterize an aircraft's behavior. Since it is defined relative to other quantities (lift, speed), it remains consistent even when conditions change.
The moment coefficient is defined as follows:
CM = M / (½ * ρ * V² * S * c)
where:
- M is the absolute moment about the center of gravity,
- ρ is the air density,
- V is the aircraft's speed,
- S is the wing area,
- c is the average chord length of the wing.
The above is applicable to normal aircraft with rigid wings and a fixed center of gravity.
For flexible hang gliders with weight-shift control, the moment coefficient is additionally dependent on the wing loading (due to wing deformation) and the current center of gravity location. When comparing the moment coefficients of different hang gliders, it must therefore be ensured that the wing loading level (airspeed) and the center of gravity position are identical.
Comment: Due to the dependence of the moment on the load factor, the moment is measured at different speeds for the certification of hang gliders. Different certification limits are defined for each speed.
The unique moment diagram of hang gliders
In the moment diagram, the moment coefficient is shown as a function of the angle of attack. A positive moment indicates a nose-up tendency (pitching up), while a negative moment indicates a nose-down tendency (pitching down). Steady flight is therefore characterized by CM = 0.
For conventional aircraft, the diagram consists of a single curve. However, since the pitching moment depends strongly on the center of gravity position - and hang gliders are controlled by shifting the center of gravity - there are practically an infinite number of moment curves for hang gliders. The following diagram (Figure 3) shows the curves for trimmed flight, slow flight, and high speed flight.
The moment curves shown are based on measurement data for a modern topless flexible hang glider at an airspeed of 40 km/h.
The differing shapes of the curves depending on the center of gravity respectively pilot deflection are clearly visible. The range of angles of attack for steady flight extends from approx. α = 12° (maximum flight speed) to about α = 37° for minimum flight speed (stall limit). However, during unsteady flight conditions, any angle of attack may occur, ranging from –180° < α < +180°.
All the moment curves intersect at CM0 (CM0 refers to the moment coefficient at α0, the angle of attack at which lift is zero). This must be the case, because without lift, the total moment is independent of pilot displacement (see Figure 2). No lift means no moment - regardless of the moment arm (i.e., the pilot's displacement). Therefore, CM0 must be the same for all pilot positions. Since aerodynamic lift increases linearly with angle of attack, the moment curves pivot around CM0. This behavior is a unique characteristic of weight-shift-controlled hang gliders.
Also clearly visible is the previously mentioned control reversal for α < α0. In this range, pushing out (i.e., shifting the pilot's weight backward) leads to a dramatic reduction in moment, even resulting in negative moments. Every hang glider pilot must be aware of this! Understanding control reversal is essential for preventing tuck accidents.

Another interesting aspect is the moment curve during trimmed flight. Trimmed flight is characterized by the absence of bar pressure, meaning it makes no difference whether the pilot grips the base bar or flies hands-free. For this reason, the diagram also includes the moment about the hang point (shown as an orange dashed line), which serves as a measure of bar pressure. The angle of attack for trimmed flight (αTrim) is where both the moment about the overall center of gravity and the moment about the hang point are zero (CMTotal = CMHP = 0).
The hang glider can be trimmed by slightly shifting the hang point (🟠). Just like the total moment curve, the hang point moment curve also rotates around CM0. Shifting the hang point rearward flattens the curve and shifts CM = 0 to a higher angle of attack, resulting in a lower trim speed. Shifting it forward, on the other hand, steepens the curve and moves CM = 0 to a lower angle of attack, increasing the trim speed. This fine-tuning is a key tool for adapting flight characteristics to the pilot's preferences or conditions.
The moment curves around the reference point for hands-free flight (▼) as well as for the glider alone (without the pilot; 🟦) differ only marginally from the curve about the hang point, since the respective moment reference points are located very close to each other. To keep the diagram clear and readable, these additional curves were omitted.
One more interesting point: Every hang glider pilot knows that the glider flies much less stable when flying hands-free compared to holding the base bar. This behavior is easy to interpret using the moment diagram. Longitudinal (pitch) stability is characterized by the slope of the pitching moment coefficient curve at CM = 0. The steeper (more negative) the slope, the greater the stability. When the control bar is held, the blue moment curve applies. For hands-free flight, the orange dashed curve applies, which has a significantly flatter negative slope than the blue one. So, in trimmed flight (and unfortunately only there), the pilot holds the power to choose the level of stability by either gripping the bar or not. Cool, isn't it?
Tuck avoidance
Tuck and near-tuck video examples
Below are links to 5 different videos in which tucks or near-tucks occur.
Although the initial situations and the sequence of events appear to be very different, it will be shown later on that they all follow the same pattern and can therefore be avoided using the same control methods.
Analysis of the Sensor video
Firstly, the analysis of the Sensor video (tumbling a hang glider):

In keywords:
- The pilot wants to initiate a spin, but does not succeed (Point 1 in the slide). The angle of attack is very high (estimated α>45°). He is probably already in a stall.
- To stop the stall, the pilot pulls in slightly to the trim position (Point 2). The angle of attack is unchanged. The moment is now clearly negative. This leads to the extreme pitch-down.
- In exactly this pilot position (relative to the wing), the system - consisting of wing and pilot - continues to rotate. The angle of attack is continuously reduced. In the diagram, the hang glider moves from the right to the left on the blue curve.
- At Point 3, the blue curve intersects CM=0 at alpha=25°. The area under the (negative) moment curve (between Point 2 and 3) is a measure of the strength of the rotational excitation.
- For α<25° (to the left of Point 3) the moment is now positive. The deceleration of the rotation has started.
- α0 is reached at Point 4. From then on, the lift becomes negative, which results in a reversal of the control effect (see Figure 2).
- Up to this point the hangstrap is tight!
- If the pilot would remain in this position relative to the wing, it would continue to move to the left on the blue curve. The momentum there is still positive up to α~-15° and the deceleration effect would still be present. However, the pilot now has to grab firmly the basebar because otherwise he would fall into the sail due to the downforce.
- Due to the braking effect, the rotation of the wing is almost stopped at Point 5. However, due to the inertia of the pilot, the pilot continues to rotate (relative to the wing), resulting in a shift of the pilot's center of gravity backwards. This configuration corresponds to the brown curve.
- Since the angle of attack is already less than -2°, the moment becomes negative again, which results in an increase in the (initially stopped) pitch-down rotation. This is the actual tuck.
- Compare the area under the moment curve from Point 3 to 5 (deceleration) with the area from Point 5 to 6 (excitation), which is a lot larger. This is one of the reasons for the high rotational speed that is often observed in tucks.
The tuck initiation can therefore be separated into four phases. The initial phase, in which the pitch-down moment is generated and the excitation phase (CM<0), in which the rotation is excited. This is followed by the deceleration phase (CM>0), in which the rotation is slowed down. In the last phase, it is then decided whether a tuck occurs (CM<0) or not (CM>0).
The four different phases are shown in detail on the following slide.

The pictograms in the diagram are intended to indicate the approximate pilot position. They are aligned according to the mean attitude angle for each phase.

And this is what the pilot himself says about his stunt:
https://forum.hanggliding.org/viewtopic.php?p=150334#p150334
Also read his following posts in this thread. The last one ends with the sentence:
"Im pretty sure if i were on the basetube and just put hte bar to my knees i would have just stopped at "s---"
How true.
The initiation of the tucks or near-tucks in the other videos can also be subdivided into the 4 phases. The individual phases are just more or less pronounced.
Analysis of the U2 video
In the U2 video (Hang Glide Reserve Deployment), the initial state of the tuck initiation is at a significantly higher angle of attack compared to the Sensor due to its flight attitude (nose high) at the onset of the stall (Point 1). In addition, the pilot pulls in more, which results in a very negative moment (Point 2). The diagram of the U2 clearly shows that Phase 1 is much more dominant compared to the Sensor. The area under the moment curve is huge due to both the range of the angle of attack and the more negative moment (max. pulled-in).
The opposite is true for Phase 2. As the pilot remains in a fully pulled-in position (green curve), the zero-crossing of the moment curve (Point 3) shifts to the left to a smaller angle of attack. The area under the (positive) moment curve is therefore noticeably smaller compared to the Sensor and the decelerating effect is thus significantly reduced. No substantial reduction in the rotational speed (as with the Sensor) can be observed in the video.
But even then, the U2 would not have tucked if the pilot had stayed in front. Either he pushed out reflexively after Point 4 or, like the Sensor pilot, he was "pushed backwards" by the glider due to his inertia (despite the reduced rotational deceleration compared to the Sensor).

Analysis of the Falcon video
In the Falcon video (Extreme Hang Glider Whip Stall) you can see a pilot who is only a passenger of his own hang glider most of the time. Due to the excessively high towing speed, he is hanging paralysed in his harness until he releases the tow rope or the weak link breaks. Due to the overspeed, the hang glider then pitches up to an almost vertical attitude. In terms of flight attitude, this is really the worst position.
It should also be noted that the pilot's legs are temporarily bent up to 90°, which means that the pilot's center of gravity is slightly further forward.
In the initialization phase (Point 1), the hang glider nose points vertically upwards and the pilot is approximately in the trim position. At the onset of the stall, the hang glider is likely to slide backwards, which would be equivalent to an angle of attack of 180°. It couldn't be worse!
In the diagram, Point 1 of the initialization phase is therefore far outside the angle of attack range shown. The pitching moment curve continues to decrease steadily in the area not shown, so that there is an extremely high pitch-down moment at Point 1. Fortunately, the pilot is only slightly in front of the trim position and does not pull-in excessively. This would have resulted in an even worse pitch-down. Even so, the area under the moment curve in Phase 1 is huge compared to the Sensor and U2.
In this slightly pulled-in pilot position, he rotates very quickly up to an almost horizontal attitude. From then on, the pilot begins to push out and his legs additionally move backwards. The pushing-out should still have taken place within Phase 1, so that the control must have been actively executed by the pilot and not by the pitching moment of the wing (moment is still negative here). In this rear center of gravity position, the wing continues rotating until the nose is pointing vertically downwards.
This fully-pushed-out position is very beneficial, as it reduces the negative moment in Phase 1 (less excitation) and significantly increases the positive moment in Phase 2a (stronger deceleration). In the diagram, the moment changes from the blue to the yellow curve.
As a result of the increased deceleration of the hang glider, the pilot (due to his inertia) is accelerated backwards much more violently relative to the hang glider (compared to the Sensor). This would have inevitably led to a tuck if there wasn't a fundamental difference to the Sensor and U2: By clutching the control bar extremely tightly, the pilot does not rotate around the hang point (like the Sensor and U2 pilot) but around the control bar! The pilot's center of gravity does NOT move further backwards but instead slightly forward again until the pilot is aligned parallel to the control frame! In the diagram, the moment curve in Phase 2b is back on the blue curve. A small but essential difference with a big effect! The hang glider does not tuck, although the rotation is only stopped at an angle of attack significantly lower than α0 (recognizable by the negatively deflecting sail and the tensioned luff lines).

Analysis of the Laminar video
The fact that nuances can make the difference between tuck and recovery can also be seen in the Laminar video (Whip Stall in Laminar14MRX). Phase 1 corresponds somewhat to that in the U2 diagram, Phase 2 to the Sensor and Phase 3 more to the Falcon. For this reason, a separate Laminar diagram has been omitted.
In the initialization phase, the pilot pulls in a little earlier than the U2 pilot (you have to watch the video very carefully). The stall is therefore not yet fully established. Compared to the U2, Point 1 and therefore also Point 2 are at a slightly lower angle of attack. The extent of Phase 2a corresponds approximately to that of the Sensor.
The rotation was probably already completely stopped in Phase 2b near α0, as no unloading of the main suspension can be observed. Only the briefly visible decrease in the dihedral indicates that the angle of attack was minimally below α0 (downforce). In this case, Phase 3, i.e. pitching up, follows to the right of Phase 2b.
Important: in Phase 2 and 3 the center of gravity was at no time behind the trim position!
This relationship between the center of gravity and tuck or recovery is illustrated again in the following slide:

Analysis of the "Tuck out of the blue" video
The fifth video (Hang glider Tuck and in air collapse Tolmin Slovenia) is a very rare documentation of a tuck out of the blue. In contrast to the previous videos, in which the tuck initiation is predictable (either due to the high angle of attack and/or the pilot's deliberate control input in Phase 0), here the hang glider tucks suddenly out of a normal gliding attitude.
Jesper's video seems to be “the film to the book”, i.e. Adam Parer's report from 2009. I have the impression that Adam describes exactly the same tuck initiation that can be seen on Jesper's video. Adam also mentions Andreas Orgler's tuck, which seems to have a similar initiation: (1) http://ozreport.com/13.238 (2) https://ozreport.com/docs/AdamParerAccidentReport.pdf (3) https://xcmag.com/news/there-i-was-hang-gliding-horror-down-under/
Jesper writes in his comment on his YouTube video:
„For an in-depth look, check out the [IGC Replay]( https://replay.flights/1z9CGwY ). I've reviewed the footage extensively but cannot identify any clear mistakes or preventive actions. I'm seeking insights and detailed analyses from experienced pilots to understand what might have caused this incident and how to avoid such situations in the future.“
And further on:
„Please review the video and share your expert thoughts in the comments. Let's ensure safer flights for all.“
How right he is! Hence the detailed analysis below. I am only focusing here on the tuck initiation (until the hang glider flies inverted). Although the following in both Jesper's video and Adam's report is also super interesting and quite spectacular, it is explicitly not part of this analysis, as from this point onwards the pilot is only a passenger and can no longer intervene in the steering. You are then helplessly at the mercy of what follows.
This tuck initiation can also be broken down into the four phases described above. The only difference is in Phase 0, where the high angle of attack is generated by a strong gust that must have come from behind below (The influence of gusts on longitudinal stability is described in detail later in a separate chapter). Phases 1-3 then proceed in the same way as in the previous videos.
The following are the most important findings from the data analysis in bullet points:
- Turbulent air. In the last ½ minute before the tuck, the vario displays values between +4m/s and -5m/s. In the last 5 seconds before the tuck, the sink rate decreases from -5m/s (t_Replay=14:26:06) to -2m/s (t_Replay=14:26:11).
- t_Video=0s: Straight flight, maybe with a slight right turn. The hands are relaxed on the speedbar. The pilot's position is centered in the trim position. The VG rope is symmetrically aligned (symmetrical airflow from the front).
- t=2:20-3:00s: The hang glider begins to yaw to the right (see VG rope deflection to the right). The wing is banked slightly to the right. However, there is no rotation around the longitudinal axis.
- Jesper corrects a left-side lift (?) several times and with increasing intensity: first with half, then with full weight shift to the left and finally he shifts his legs as far as possible to the left (more is not feasible, as the space is limited by the left rear wire). By the way: a perfect control technique! The left-side lift must have been caused by a gust/turbulence. The gust can also be recognized by the change in wind noise. However, I myself cannot judge with 100% accuracy whether the wind speed is decreasing (which would be the case with a gust directly from behind) or increasing. But I have the impression that the wind noise tends to increase. The replay didn't show any significant change in speed immediately before the tuck. However, this may be due to the measurement method and evaluation (time-averaged speed). The right hand rests rather relaxed on the control bar the whole time. For me, this is a sign that he is close to the trim position (neither pulled-in nor pushed-out).
- With the pilot in this sideways deflected position and in this yaw attitude, the hang glider begins to pitch down. The pitching and the rotational speed can be well recognized by the relative movement of the right corner of the control bar to the trees in the background. Tests with FlightGear show that a gust from behind and below at a speed of approx. 15-20m/s is sufficient to trigger a tuck.
- At t=3:24s the downward rotation comes to a brief stoppage (see right speed bar in front of the background; you have to look very closely; frame by frame analysis!) I do not yet have an explanation for this behavior. Immediately afterward, however, a much more pronounced pitch-down occurs (pilot is still on the very left; VG rope is still blown out to the right).
- t=4:12s: The yawing has stopped (VG rope is centered again). The main suspension begins to become slack (first visible at the top of the hang strap). The arms are already slightly pushed-out. The lateral pilot deflection remains unchanged to the left. This situation corresponds to Point 4 in the diagram. The nose of the hang glider is not yet pointing exactly vertically downwards.
- t=4:15s: Jesper is still on the far left. His arms start pushing out. It would be important to know whether he has actively pushed out or whether the control bar has only moved forward without his intervention and how the bar pressure has changed in direction and strength. In this phase there is no slowing down of the rotation of the wing observable (in contrast to the tuck of the Sensor). It looks rather similar to the tuck of the U2.
- Then, due to the rear center of gravity position (fully stretched arms), an extremely fast rotation begins. Jesper drifts from the sideways deflected position to the center. The right hand no longer rests relaxed on the control bar (Is this an indication that he has pushed out deliberately?).
- t=5:08s: At this point, the harness/legs fall symmetrically into the rear wires. The negative lift forces are now only transferred to the pilot via the rear lower wires and the hands at the control bar. The nose of the hang glider points vertically downwards.
- t=4:18s to 5:18s: Continuous increase of the negative dihedral (increasing negative aerodynamic force).
- t=5:16s to 5:18s: The left and right uprights bend symmetrically outwards. The hands are still holding the control bar and the feet are still resting on the lower rear wires.
- t=5:19s: Breakage of the right upright. Right hand loose (?). t=5:20s: Right hand back on the control bar but further left. t=5:21s: Right hand loose again. Left hand continues to clutch the control bar. The hang glider is approximately inverted (see alignment to the horizon).


Could Jesper have avoided the tuck?
Yes, of course!
Either he could have flown a little faster (pulled-in slightly). This would have made him less susceptible to gusts or, ideally, he should have been in the maximum possible forward pilot position at Point 5 in the diagram (at the very latest at α=-4°; CM=0). Admittedly, the time window for pulling-in is very short (approx. 1s). It is therefore important to be mentally prepared in advance and to have automated control reflexes. You can practise this with FlightGear, for example. 😉
Impact of VG setting on tuck susceptibility
Activating the Variable Geometry (VG) system not only improves performance and worsens the handling of the hang glider, but also significantly alters the pitch moment characteristics.
Figure 12 shows the measured moment curves for both a fully relaxed VG (VG 0%, blue curve) and a fully pulled VG (VG 100%, dark red curve) at a flight speed of 40 km/h. To improve comparability, both curves were shifted along the x-axis so that α0 aligns with the origin.
It is clearly evident that at VG 100%, the pitch-down tendency is significantly more pronounced. Phase 1 spans a much wider range of angles of attack. Additionally, in Phase 2, the deceleration of rotation is significantly reduced, as it occurs over a smaller angle-of-attack range compared to VG 0%, and the pitching moment is noticeably lower. Both of these factors contribute to a more aggressive nose-down behavior. The more the VG is pulled, the more aggressive the pitch-down becomes.
Even minor disturbances can cause a sharp nose-down pitching motion, increasing the risk of a tuck. Therefore, flying slowly with a pulled VG requires heightened attention. In turbulent conditions, the pilot must always be prepared for sudden nose-down behavior and remain on high alert at all times. Once the nose drops, the reaction must be extremely fast. Ideally, the pilot's arm muscles should be “spring-loaded” to allow for pulling in immediately without hesitation.
In general, in turbulent air slow flight with VG pulled should be avoided — or performed only by pilots who have fully understood and internalized the principles explained in this article.

Impact of gusts on pitch stability
Gusts are brief fluctuations in wind strength and direction. One problem is that gusts can sometimes occur very unexpectedly, even if there was almost no wind a short time before. Moreover, they are typically invisible and therefore difficult to predict. Often it only takes a few seconds before the blast is over again. There are many reasons for this: it can be turbulence, wind shear, vortices, wakes, etc. . The spatial extent of this disturbance can vary by orders of magnitude.
As hang gliders are slow-flying objects, they are very vulnerable to gusts. Even moderate gusts can have a major impact on the flight behavior, as the angle of attack and the inflow velocity can change dramatically.
The new inflow speed and direction can be easily determined by vectorial addition of the gust with the undisturbed inflow (speed triangles). Examples of this are illustrated on the following slide.

On the next slide, the influence of the gust on the airflow is shown quantitatively. Two different gust strengths (5m/s and 10m/s) are examined for an airspeed of 40km/h (11m/s, approx. trim speed, left diagram) as well as for a very high airspeed of 100km/h (approx. 28m/s, right diagram).
The gust direction is plotted on the x-axis. The angle is defined in relation to the undisturbed direction of the airflow.
The orange curve describes the change in angle of attack Δα induced by the gust (left y-axis).
The blue curve shows the influence of the gust on the inflow velocity. This is best represented by the ratio of the dynamic pressure of the disturbed flow velocity to the dynamic pressure of the undisturbed velocity (right y-axis). The idea behind this is that the absolute aerodynamic forces and the absolute momentum scale linearly with the dynamic pressure (Pdynamic = ½*density*velocity2). This means, for example, that a doubling of the free flow velocity due to a gust leads to a 4 times higher aerodynamic force and moment. Therefore, this representation is more meaningful than the application via the velocity ratio. The value is just the factor by which the undisturbed aerodynamic force and the moment must be multiplied to obtain the new values with gust.
When comparing the curves for the two airspeeds, it is clear to see that gusts have a much more dramatic effect at low speeds, both in terms of strength and direction.

This can also be seen clearly on the next slide, where the gust with the highest possible change in angle of attack is shown in the moment diagram for the two flight speeds. A gust with an upward component increases the angle of attack and with a downward component reduces it (simply mirrored).
For α<α0 downforce (negative lift) occurs, which leads to a "wire slap" or slack hang strap. A 5m/s gust can be sufficient for this regardless of the flight speed.
The influence of flight speed is much more different with gusts that increase the angle of attack. The huge impact of a strong gust at the low flying speed can be seen very clearly. This can increase the angle of attack far into the stall range. The maximum angle of attack with a 5m/s gust is already similar to that AoA reached by the Sensor before the pull-in. With the 10m/s gust, the angle of attack is so high that the moment coefficient CM is in the order of magnitude than that for the Sensor after the pull-in. Although the absolute moment is reduced by a factor of approximately 2 (due to the decreasing inflow velocity), it is nevertheless likely to be just as large or even larger compared to the Sensor, where the airspeed was also relatively low due to the stall.
That demonstrates that at low flight speeds, gusts have the power to trigger "tucks out of the blue".

If you now think you have understood the influence of gusts, you are terribly mistaken. The curves only give a rough indication of the change in moment caused by a gust. However, so far we have not taken into account that the temporal characteristics of the gust also have a major influence on the flight path. The time in which the gust builds up, the duration and the decay all play a role. It is also important to note that the decay of a gust has exactly the opposite effect to that of its build-up. For example, a gust from below (+90°) is equivalent to a gust from above (-90°) when it decays.
Tests with FlightGear show that the whole process is extremely unsteady and that the reaction to a gust can be different from what the curves suggested so far.
This is highlighted in the following video. Here, the influence of a 10m/s gust is examined for different gust directions. All other parameters remain constant: the airspeed is approx. 45km/h in all cases, the gust build-up lasts 0.5s, the duration is 2s and the decay 0.5s.
It should also be noted that initially no attempt was made to compensate for the gust by steering. In reality, the change in attitude is of course not so extreme, as the pilot will compensate for the gust by (instinctive) controlling.
The inflow is visualized by the displayed red vector. The length of the vector represents the inflow speed and the angle in relation to the keel tube represents the angle of attack.

Video about the influence of gust direction on pitch stability:
Flight speed approx. 45km/h (12.5m/s);
Gust strength 10m/s (strong gust);
Gust startup-duration 0.5s, steady duration 2s, end-duration 0.5s
In the following, the complexity of the flight dynamics will be explained in more detail using two examples from the video.
Gust directly from the front
In the following, the first sequence in the video will be analyzed: Gust directly from the front.
The hang glider is initially in a steady straight flight (CM=0). In a gust directly from the front, only the inflow speed changes, the angle of attack does not change. Therefore CM remains the same. But why does the hang glider then pitch up?
The previous diagram (Figure 14) shows that the dynamic pressure increases by a factor of approx. 3.5. This does not have any effect on the absolute moment, as 0*3.5 is still 0. However, the aerodynamic force / lift also increases by this factor. The hang glider is therefore accelerated upwards by the higher lift (first without changing its attitude). The superposition of this rate of climb with the inflow velocity results in a reduction in the angle of attack. We move on the moment curve (blue curve in the moment diagram) to the left. Although the change in angle of attack and hence the increase in moment is only minimal, the absolute moment increases by a factor of 3.5, which in the end leads to the significant pitching up.
This is exactly what you can see in the video (but you have to look very closely): First, the red inflow vector becomes longer without changing its direction. Then, for a fraction of a second, you can see the vector turning downwards without the hang glider changing its attitude. Only then the hang glider starts to pitch up.
Gust directly from above
In the following, the 6th sequence in the video (t=1:52) will be analyzed: Gust directly from above (-90°).
The negative angle of attack due to the gust initially only leads to a harmless "wire slap". The hang glider is pitching up slightly. However, the sink rate increases (see vario) as there is no lift for a while. Up to this point, everything is pretty safe.
Only afterwards it becomes interesting: Why does the hang glider is pitching down so rapidly?
The timing of the gust in this example is just such that the gust begins to decay after 2.5s, which corresponds to a gust directly from below (+90°). The inflow velocity is added to the already high sink rate (-5m/s) at this time. This means that there is a high inflow velocity at a high angle of attack. This must inevitably lead to a violent pitch-down!
It can also be seen in a positive light: The "wire slap" is the alarm for pulling in! Depending on the duration of the gust, the pitching down may not be so strong, however it could occur. You are therefore on the safe side by pulling in.
Example of a gust from behind
If a gust comes from behind, the wind noise must decrease. This can be heard in the next video example (turn the volume up!). At first, the wind noise decreases to almost nil. Only then the hang glider starts to pitch down.
The wind noise can therefore be a further alarm signal for pulling in.
Note that here the pilot also rotates around the control bar and hence his center of gravity does not move backwards.
There is a (short) prewarning time for gusts from above and from behind. Unfortunately, this is not the case with gusts from below.
The above examples apply to gusts at low flight speeds. As already mentioned, at high flight speeds the influence of gusts is less severe. Below are two examples:
Scary but not dangerous at all! At least as far as pitch stability is concerned. Structural integrity is a different story.
Why all this theoretical crap? So how can I avoid a tuck in practice?
Well, if things are completely out of control (i.e. a situation arises that you didn't expect and/or scares you to death), simply apply the golden rule of hang gliding:
Shift the center of gravity as far forward as possible.
In most cases, the problem will have solved itself by then.
This requires the following actions:
- Pull in as fast and as much as you can (without thinking too much - you don't have that time).
- Be prepared to pull in hard to counteract the force of the control bar.
- Prevent the control bar from moving forward by itself under all circumstances. This is extremely important!
- As soon as the hang glider is flying stabilized again, wait a short time just to be on the safe side.
- Then gently recover from the dive by letting the control bar move forward slowly.
- Don't forget to start thinking again.
That's all!
The above applies to unpredictable and sudden events. For planned actions such as the intended flying of whip stalls, acro, etc., however, a lot of thought should be given beforehand. Therefore, a little theoretical knowledge can't hurt.