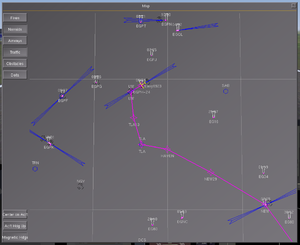
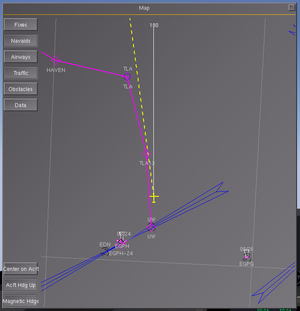
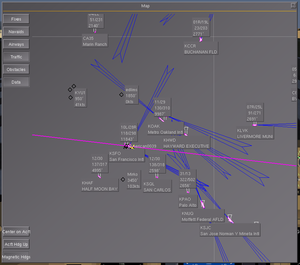
Map dialog
As of version 2.4.0 a map dialog is available in FlightGear. You may be looking for Atlas, which provides high-quality digital charts via a separate application, or the multiplayer map, a Google Maps overlay displaying similar data.
Introduction
The map dialog aims to provide a visual representation of navigation data in the simulator - i.e airports, runways, navaids, and so on. It does not display any geographical data (borders, coastlines, roads or rivers) at all, though support for basic borders and coastlines may be added in the future. Multiplayer traffic can be shown, and in the future airways, obstacles and other object types may be displayed. Data can be shown about items in the map, such as the frequencies of a navaid, or the length and bearing of a route leg.
Aircraft information is also shown, notably the current ground track (derived from the GPS) and heading. Optionally, the map can be orientated so that the aircraft heading points upwards, allowing the map to be used as a crude generic navigation display. (Some of the symbology and colours used are intentionally similar to a Boeing ND)
Usage
Make sure you see the menu bar (F10 to toggle). Open menu "Equipment" and activate "Map".
Drag with left mouse button to pan the map, and use the mouse-wheel to zoom in and out. You can also pan using the cursor (arrow) keys, and zoom using the +/- keys. Control-click to place a marker point - a line (in cyan) will be drawn from the aircraft position to this location, and the distance and bearing will be displayed (and updated as the aircraft moves).
The tuned VOR(s) and their selected radials and range-circle will be displayed (in cyan), assuming the aircraft is within range of the station. When tuned to an ILS, the corresponding localizer will be displayed in cyan instead of blue.
Status
For FlightGear 2.99/3.0+ please also see MapStructure and A Canvas-based Map dialog
The original code was an experiment - hopefully it is useful, but the primary aim was to investigate creating such displays, as a precursor to developing accurate in-panel displays in the future.
The current display is implemented almost entirely using individual OpenGL calls, with no state tracking or inter-frame persistence of symbol data. This means it's just about the slowest conceivable way to generate the display (using OpenGL), but was relatively easy to develop quickly. As mentioned above, one of the goals was to investigate the performance required to display tens or hundreds of map symbols (and accompanying text) each frame, in addition to the other rendering tasks.
Known issues and limitations include:
- performance degrades dramatically when zoomed out - potentially to the point where the simulator crashes.
- since anti-aliasing is not enabled, many aliasing artefacts occur rendering map symbols.
- the clutter-supression scheme is simplistic, and only partially tuned - often it is necessary to zoom in to reveal information.
Planned improvements
| IMPORTANT: Some, and possibly most, of the features/ideas discussed here are likely to be affected, and possibly even deprecated, by the ongoing work on providing a property tree-based 2D drawing API accessible from Nasal using the new Canvas system available since FlightGear 2.80 (08/2012). Please see: MapStructure#Porting_the_map_dialog for further information
You are advised not to start working on anything directly related to this without first discussing/coordinating your ideas with other FlightGear contributors using the FlightGear developers mailing list or the Canvas subforum |

|
- airways layer (actually separate layers for high- and low- level airways)
- scale indicator, probably in a corner / edge of the display
- national borders & coastlines rendering
- improved clutter-supression, especially when zoomed out
- alternative cartographic projection schemes (in addition to the current Sanson-Flamsteed projection)
- switch to retained-rendering for symbols (in addition to labels/data), and hence apply prioritisation and culling to symbols. This should greatly reduce clutter, and increase performance, when zoomed out
Unplanned improvements
Things here would be nice to have, but aren't judged to be that important - if you disagree, please let James know.
- display airport parking positions
 Done (in Canvas/MapStructure)
 - piggyback the wxRadar code to show cloud density as an overlay
 Done (in Canvas/MapStructure)
 - use terrain height intersections to compute a EGPWS / G1000-style terrain clearance overlay (do-able in Canvas/MapStructure) - also required for the Avidyne Entegra R9


