JSB to PNG
JSB to PNG will take a JSBSim file as input and will then output PNG images of the tables in that file.
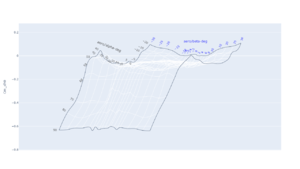
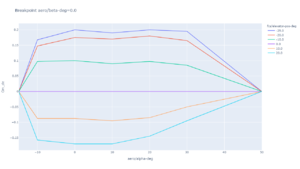
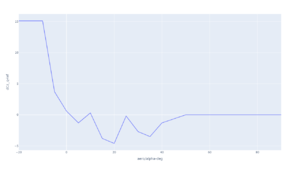
It will output both lines and carpet plots for 2D/3D tables. For 1D tables just line plot.
JSB to PNG is written in Python.
Instructions
Required libraries
JSB to PNG requires Python with plotly.express and plotly.graph_objects libraries (recent version).
JSBSim table requirements
Each table in the JSBSim input file that you want to graph must have name attribute in the
<independentVar> tags must all have lookup attributes.
Example:
                 <table name="Groundeffect normal force">
                    <independentVar lookup="row">aero/h_b-mac-ft</independentVar>
                    <independentVar lookup="column">aero/alpha-deg</independentVar>
                    <tableData>
                               0.0     5.0    15.0     90.0
                        0.0  0.0000  0.2000  0.6500  -0.2500
                        2.2  0.0000  0.0000  0.0000   0.0000
                    </tableData>
                </table>
Running JSB to PNG
JSB to PNG is used from the command line with this syntax:
python jsb-to-png.py [filename]
If no filename is specified as commandline argument then jsb-test.xml is assumed.
When run, a folder will be created in working folder named same as the JSBSim input filename, but without the xml extension.
For 2D and 3D tables it will graph both a lines and a carpet plot.
In that folder PNG of the tables will be output, it will overwrite images if the folder is not empty.


