Property Tree Performance
| This article is a stub. You can help the wiki by expanding it. |
Background
getNode("foo") and getChild("bar") consumes CPU while setFloatValue() seems to be quick.[1]
when writing to the property tree. Yasim creates ~250 surfaces for the CRJ700 and ~150 for the Citation II If I try to write data for those surfaces to the property tree (at FDM rate), frame delay rises rapidly, if I write more than 4 or 5 values per surface. I use getNode(), getChild(), set/get*Value()[2]
That seems to be about the I/O speed of the property tree. Don't do it at FDM rate for starters, do it only as fast as you actually need and stagger the process.[3]
somewhere in SimGear/props there should be some kind of standalone C++ benchmark that David M. originally came up with and that Andy later on used to test his assertion that he could directly use properties (instead of properties tied to raw C++ PODs) in YASim (and he ended up being correct).
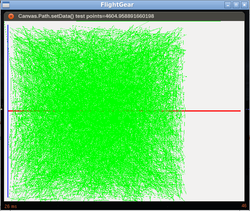
For a more recent benchmark/test case (self-contained via the Nasal Console), see:
Howto:Canvas Path Benchmarking
we've been tossing with the idea of using Tom's cppbind framework to update/modernie the props.nas/props.cxx stuff - and it would obviously also help with Canvas related stuff where lots of property tree I/O is a factor (i.e. taxiways layer) - so given that 3.0 is now out, this could be a good opportunity to re-implement props.nas on top of cppbind - indeed, it would be interest to benchmark a test case first - in theory - once implemented in native code, a cached property.setValue() call should be faster than plain setprop("foo", value).[6]
here is a fair degree of property I/O taking place here behind the scenes - keep in mind that you are typically setting hundreds, if not even thousands, of properties before you end up with a Canvas/Element representation of the corresponding SVG/XML "object". You can basically wrap the call in between two systime() calls or use debug.benchmark(func() {YOUR CODE HERE});
When you do that with the BUILT-IN PROFILER (wiki) enabled/running, you will undoubtedly see tons of property and Nasal overhead.
That is the reason why we ended up introducing the SymbolCache framework for elements that are "semi-static", i.e. that mainly differ in terms of transformation, color, label etc - i.e. style-able attributes. The ND rendering hundreds of symbols would otherwise also have the same I/O overhead due to all the Nasal and property tree "context switches".
What worked fairly well was identifying the bottleneck (we used the profiler for that) and then we moved /some/ helpers to C++ space.[7]
Property name lookups are slow, there are some tricks to optimise that we could do, especially using a global hot cache. This would also allow an easy way to fix problem cases, by taking the hottest entries and fixing their call sites to cache the node. The first thing, however, is extending the existing unit test to do some basic benchmarking of reads & writes, and name lookups. And then the same but in the presence of narrow and broad listeners. [8]
References
References
|
