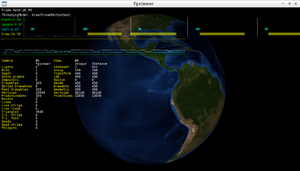
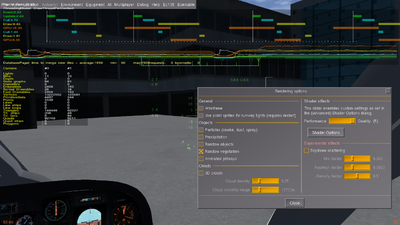
OSG on screen stats
| This article is a stub. You can help the wiki by expanding it. |
| Troubleshooting |
|---|
Caution
|
You can also try to play with osg's frame statistics, you can switch that on from the debug menu.
| The stats in "camera" table are for objects that have survived culling and are passed on to OpenGL. Vertices should be the sum of all the vertices — Tim Moore (2014-11-15). Re: [Flightgear-devel] Building of framerate doom.
(powered by Instant-Cquotes) |
Being CPU and draw limited means the yellow bar is long. And the blue one grows when cull happens to be a problem.
A simple help is to switch on the onscreen stats in the viewer or flightgear and see if the yellow bar is longer than the orange one. A yellow bar longer than the orange one means that the cpu is not able to saturate the gpu.
Again, beware this does in no way mean that you should write complicated shaders to saturate the gpu! This rather means that the geometry setup/state change time - the yellow one - must decrease!
Once your orange bar is longer than the yellow one, you can start to care for the shaders and their execution. When thinking about shaders, keep in mind that different GPU's perform very different on the same shader.
How to achieve that is a very long chain of right decisions. Starting with the modeler:
Avoid having leaf geometry with very small parts. Collapse as much triangles as sensible for culling into the same leaf geometry. Sure if geometry needs a different texture or anything that requires a different OpenGL state you cannot collapse this into the same leaf. May be it makes sense then to collapse the textures into a common one. Then you might be able to collapse more geometry.
Avoid animations that are not really required. If you need a transform node in between some geometry, the geometry below the transform needs to be drawn seperate which takes time on the cpu. Everything that needs geometry to be drawn seperately should be avoided to that level where it stops to make sense because of culling.
May be introduce some level of detail. Not just avoid the whole model in some distance, but also provide a static model without animations, simple geometry for the mid range. May be provide some more culling friendly and detaild with the animations you need for the short range.
Keep in mind that culling a model that you are close to should make you split the model into more parts that could possibly be culled away. But for culling a far away model is probably very sufficient to cull it either as a whole or not.
Avoid state changes. Use as much common state as possible. Osg does a good job in sorting together draws using the same state, but if the overall scene contains plenty of different state osg cannot change that.A new texture is a new state for example. A new shader is a new state. ....
Once your orange bar is longer than the yellow one, you can start to care for the shaders and their execution. When thinking about shaders, keep in mind that different GPU's perform very different on the same shader.
Appart from OpenGL we spend a lot of time in scenegraph traversal. This is mostly due to plenty of structural and often needless nodes in the scenegraph. The reason or this is that historically the xml files did some implicit grouping for *every* animation in the xml file. To make that reilably work Mathias had to introduce a huge amount of group nodes in the xml file loader. These really hurt today as they introduce a whole lot of group nodes that just have a single child which need to be traversed for update and for cull.
There's also the long-term plan to flatten the LOD quadtrees and transforms of the tiles. Each tile will get some top-level LOD groups for all objects (shared and static). I'm hoping in combination with the LOD-scale function in OSG, this will mean we can automatically drop random tress / building and STG objects to keep frame-rate up. (as an optional mode of course!) - we hope to simply get less tiles and models present by a better lod structure.
The trick is to minimize the number of LOD nodes introduced into the scene graph while avoiding popping effects - flattening the transforms is good to do. But some of them are critical to stay like the are or at least similar. The first one that positions objects with respect to the earth centered coordinate system for precision reasons. Also these coordinate systems coudl for drawing reasons aligned in any direction. But as long as we do simulations using the same tree and geometry alignments that we do for draw this still interferes with the bounding volumes we have for ground intersections. And this axis aligned bounding box implementation gains a lot by having the boxes horizontally aligned. Todays transforms are done so that huger things are aligned with the horizont which serves this purpose.
In FGViewer there's a PagedLOD whole world database tree running. This is similar to osg's marble dataset but carefully designed around our tile structure. Using this I think we can really replace a lot of our fine structured scenery tiles with something more croase that is used for tiles more far away. Drawback with our current codebase: Our integration of the particle systems need to be rethought as this contains geometry with culling disabled which makes a pagedlod just never expire. Switching the particle systems off works pretty good so far.
Another goal is to add more node bits (and a GUI dialog to control them) so various categories of objects can be disabled during the update pass. This will mean the direct hit of, say, AI models vs particles vs random trees can be measured. Of course it won't account for resources (memory, textures) burned by such things, but would still help different people identify slowness on their setups.
Profiling shows that Group::traverse is the most used function in flightgear. The lowest hanging fruit could be to optimize away the redundant nodes from the top level model that gets loaded by a database pager request. We cannot do that recursively once a model part is loaded since the mentioned grouping nodes might be referenced in any level in the model hierarchy above the currently loaded model. So only the top level model could do this without braking tons of models.
At the highest level:
- Update: cpu processing your application is performing
- Cull: cpu processing performed by osg in traversing the scene graph and packaging drawing state
- Draw: cpu processing for sending drawing state to gpu and gpu processing of the drawing state
If Update stage is large, you need to determine what part of your application is taking the time and optimize it.
If Cull stage is large the scene hierarchy is too complex and needs to be optimized - spatial optimization, flatten static hierarchies, ... Cull times can be improved by splitting the Cull operations over concurrent threads. In the case of Flightgear you can do this by using the following command-line parameter:
--prop:/sim/rendering/multithreading-mode=CullThreadPerCameraDrawThreadPerContext
See: Multi core and Multi GPU support
If Draw stage is large then you need to determine if you are geometry (drawable or vertex) or pixel limited. If you grab the window corner and shrink/expand it's size
and the performance increases/decreases significantly, then you are pixel/fill limited (too much depth complexity/too much pixel processing).
If the performance doesn't change then the most likely cause is scene complexity at the object level, drawables in the osg stats table. This has a far greater impact on Draw (and as stated above on Cull) than the number of vertices in the scene. This impact is such that a scene with double the vertex count, but half the drawable count of a less detailed scene renders faster. This is caused by the fact that for sending each drawable the OpenGL state machine needs to be reset. Vertex count starts having an impact only for extreme values (millions of vertices; this however doesn't mean you should ignore the possible performance impact caused by it)
In short, if you want to improve the detail of a scene without causing a big performance drop, make sure you have as little detailed object-material(texture) pairs as needed. Ideally you would merge all meshes that are opaque, share the same material, and are not animated into a single mesh and if needed use a single texture, same for transparent mesh parts that are not animated (they should be split from opaque parts), leaving as individual meshes only those parts that will have animations attached
It's actually much more complex than this, but it's how you can start diagnosing performance issues.
Run your scene in osgViewer to see how fast it renders. You might have to build the scene in your regular app and then save the scene root to an .ive file, which you can load into osgViewer.
A really good tool to use is an OpenGL command logger. It logs all the actual OpenGL commands that OSG is issuing and can help identify problem areas.

