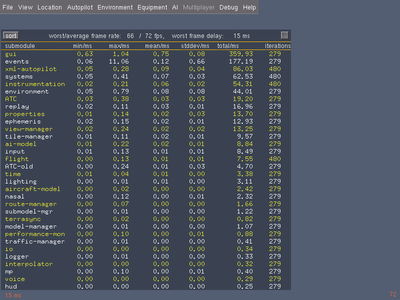
Screen shot showing the system performance monitor available in FG 2.6.0+
When using the performance monitor, you might not want to use the built-in GUI dialog to display the performance monitor, instead use the property browser to enable the performance monitor and then use the property browser and/or Phi (mongoose) to browse those stats - otherwise, the stats will be heavily affected by the PUI graphics engine and the Nasal overhead.[1]
Browse to /sim/performance-monitor, enable the performance monitor by toggling the "enabled" property (setting it to true).
Next, a corresponding "subsystems" entry will show up that lists all subsystems underneath.[2]
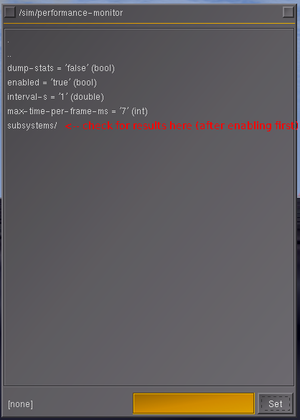
enabling the performance monitor manually using the property browser
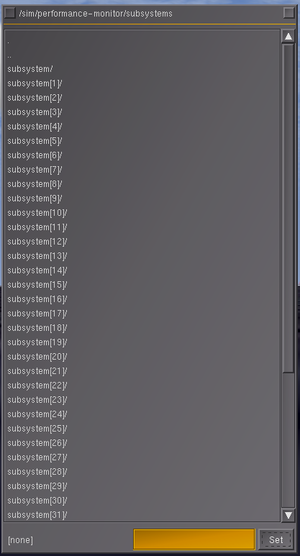
property browser showing list of subsystems (via performance monitor)
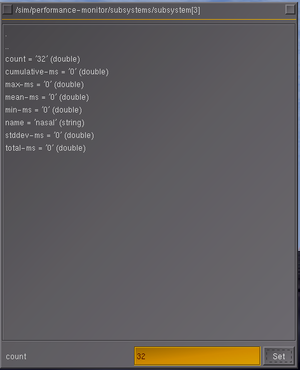
property browser showing performance monitor/subsystem entry (nasal scripting)


