Howto:Use the system monitor: Difference between revisions
mNo edit summary |
|||
| Line 1: | Line 1: | ||
== The system monitor == | == The system monitor == | ||
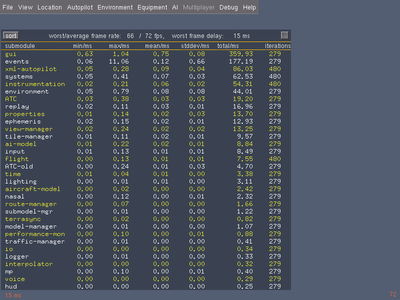
[[File:System-performance-monitor-fg260.png]] | [[File:System-performance-monitor-fg260.png|400px|thumb|Screen shot showing the system performance monitor available in FG 2.60+]] | ||
In FlightGear => 2.60, use the menu option Debug => Monitor System Performance to analyze stutters. | In FlightGear => 2.60, use the menu option Debug => Monitor System Performance to analyze stutters. | ||
Revision as of 11:44, 7 February 2012
The system monitor
In FlightGear => 2.60, use the menu option Debug => Monitor System Performance to analyze stutters.
In a perfect world, min/max/mean values should be almost identical for every subsystem - and standard deviation should be almost 0. Larger differences / high standard deviations result in a sloppy simulation and stuttering movements, though they'll hardly influence the frames-per-second value at all.
Also, imagine a system producing 100 frames in 0.5 seconds, then blocking completely for another 0.5 seconds. The fps display would still show "100fps", which seems great. But the 0.5 second stutter cause the visual performance to be terrible. That's why I prefer to display "(worst-case) frame spacing" instead of fps (View => Display Options => Show frame spacing). The frame spacing for the previous example would show "500ms", while a system producing 100 frames with perfectly even spacing would show "10ms".
So, frame spacing is a much better property to judge visual quality than just watching fps.
The new GUI dialog is available in the menu: "Debug" => "Monitor system performance".
- Only statistics on our "subsystems" are shown. That's the FG modules running in our single-threaded main loop. Everything outside the main loop isn't shown, i.e. there are no statistics on the GPU or OSG rendering threads (use the OSG statistics screen for these).
- Title bar shows average and worst case frame rate. In a perfect world, all frames should be spaced evenly, so both values should be almost identical. When frames are produced unevenly, then a larger difference between the worst and average frame rate is visible. Needless to say, we should try to get FG to deliver frames evenly, so movements look smooth.
- Main table shows statistics on the individual subsystems. Helps to identify how much tme certain systems currently consume, or which are responsible for jitters resulting in uneven frame rates.
- A bit background on the FG subsystems may be necessary though to really judge what's going on. For example, you'll see the "nasal" subsystem consuming almost no time at all, so it looks great. However, almost all the nasal code runs in timers, and timers are driven by the "events" subsystem. So, to judge Nasal performance, you'll mainly need to look at "events" (and yes, you'll see time being consumed and jitters being produced there).
- Statistics data is only collected while the dialog is open (or you manually set /sim/performance-monitor/enabled).
Anyway, this alone isn't improving anything yet, but having a GUI to conveniently monitor performance will hopefully help us to see where exactly we're having issues - and help us to improve...
