How to manipulate Canvas elements
| The FlightGear forum has a subforum related to: Canvas |
The purpose of this document is to introduce the plot2D tool and provide basic information about its use.
Plot2D is nothing more than a collection of helpers that aims to facilitate the task of coding. It makes intensive use of the Canvas API, a mandatory reference for those who intend to refine the result beyond what is offered by plot2D.
It is assumed here that you already have a minimal knowledge about Canvas.
For now Plot2D resides in the SpokenGCA addon (and you may download it from here) , but the idea is that in the future it could be included in the $FG-ROOT/Nasal/canvas directory.
"Create" helpers
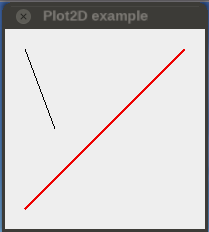
line
Parameters: (group, from, to, color)
Plots a line as <group>'s child.
- from as [x,y] in pixels.
- to as [x,y] in pixels.
- color optional as [r,g,b] or "#rrggbb", Black by default.
| example | Screenshot |
|---|---|
var window = canvas.Window.new([200,200],"dialog")
    .set("title","Plot2D demo"  );
var myCanvas = window.createCanvas()
    .set("background", "#eeeeee");
var root = myCanvas.createGroup();
var myGroup = root.createChild("group");
canvas.plot2D.line(myGroup,[20,20],[50,100]);
canvas.plot2D.line(myGroup,[20,180],[180,20],'#ee0000')
.setStrokeLineWidth(2); |
hzLine
Parameters: (group, from, length, color)
Plots an horizontal line as <group>'s child.
- from as [x,y] in pixels.
- length in pixels.
- color optional as [r,g,b] or "#rrggbb". Black by default.
vtLine
Parameters: (group, from, length, color)
Plots a vertical line as <group>'s child.
- from as [x,y] in pixels.
- length in pixels.
- color optional as [r,g,b] or "#rrggbb". Black by default.
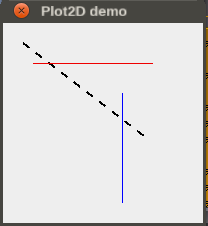
dashedLine
Parameters: (group, from, length, color)
Plots a vertical line as <group>'s child.
- from as [x,y] in pixels.
- to as [x,y] in pixels.
- dash optional dash&space lengths in pixels, 8 pixels by default.
- color optional as [r,g,b] or "#rrggbb". Black by default.
| example | Screenshot |
|---|---|
var window = canvas.Window.new([200,200],"dialog").set("title","Plot2D demo"  );
var myCanvas = window.createCanvas().set("background", "#eeeeee");
var root = myCanvas.createGroup();
var myGroup = root.createChild("group");
canvas.plot2D.dashedLine(myGroup,[20,20],[150,120]).setStrokeLineWidth(2);
var (red,blue) = ['#ee0000', [0,0,1] ];
canvas.plot2D.hzLine(myGroup,[30,40],120,red);
canvas.plot2D.vtLine(myGroup,[120,180],-110,blue); |
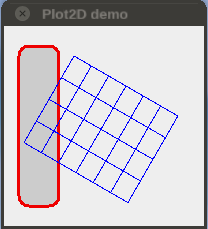
rectangle
Parameters: (group, size ,origin=nil, color="#0", fill=nil, rounded=nil)
Plots a rectangle as <group>'s child.
- size as [width,height] in pixels.
- origin optional as [x,y] in pixels, [0,0] by default.
- color optional border color as [r,g,b] or "#rrggbb" or nil (for no border). Black by default.
- fill optional fill color as [r,g,b] or "#rrggbb", No filled by default.
- rounded optional corner radius in pixels, Not rounded by default.
grid
Parameters: (group, size, dx, dy, origin=nil, color="#0", border=1)
Plots a grid as <group>'s child.
- size as [width,height] in pixels.
- dx tiles width in pixels.
- dy tiles height in pixels.
- color optional grid color as [r,g,b] or "#rrggbb". Black by default.
- origin optional as [x,y] in pixels, [0,0] by default.
- border optional as boolean, True by default.
| example | Screenshot |
|---|---|
var window = canvas.Window.new([200,200],"dialog").set("title","Plot2D demo"  );
var myCanvas = window.createCanvas().set("background", "#eeeeee");
var root = myCanvas.createGroup();
var myGroup = root.createChild("group");
var (red,blue,grey) = ['#ee0000', [0,0,1], [.8,.8,.8] ];
  ## Note: to eventually handle an element, you must assign a variable:
var myRect = canvas.plot2D.rectangle(myGroup,[40,160],[15,20],red,grey,10);
myRect.setStrokeLineWidth(3);
canvas.plot2D.grid(myGroup,[120,100],20,25,[70,30],blue).setRotation(30*D2R);
|
polyline
parameters: (group, xSet, ySet, color="#0", symmetrical=' ')
Plots a polyLine as <group>'s child.
- xSet as [x0,...,xn] in pixels.
- ySet as [y0,...,yn] in pixels.
- color optional grid color as [r,g,b] or "#rrggbb". Black by default.
- symmetrical optional string, may be 'x', 'y', 'xy' or 'yx'. Non symmetrical by default.
| example | Screenshot |
|---|---|
var window = canvas.Window.new([200,200],"dialog").set("title","Plot2D demo"  );
var myCanvas = window.createCanvas().set("background", "#eeeeee");
var root = myCanvas.createGroup();
var myGroup = root.createChild("group");
var (red,blue,grey) = ['#ee0000', [0,0,1], [.8,.8,.8] ];
   ## with default values:
canvas.plot2D.polyline(myGroup,[150,181,194,157,199],[162,130,174,138,146]);
canvas.plot2D.polyline(myGroup,[100,110,150],[50,90,100]);
   ## with symmetrical = 'x':
canvas.plot2D.polyline(myGroup,[100,110,150],[50,90,100],'#0',"x")
          .setTranslation(-10,-10);
   ## with symmetrical = 'y':
canvas.plot2D.polyline(myGroup,[100,110,150],[50,90,100],'#0',"y")
          .setTranslation(-10,-10);
   ## with symmetrical = 'xy':
canvas.plot2D.polyline(myGroup,[100,110,150],[50,90,100],'#0',"x")
          .setTranslation(-10,-10);
   ## with symmetrical = 'yx':
canvas.plot2D.polyline(myGroup,[100,110,150],[50,90,100],'#0',"x")
          .setTranslation(-10,-10);
|
grid
- p.del();
- var p=g
- p.setTranslation(0,100);
- var s='yx';
- print(s[0]);
p=gca.plot2D.redim(p,[1.2,1.2],'center-bottom');


