Canvas draw library: Difference between revisions
m (Heading level cleanup first level (one =)should not be used; fix double redirect) |
|||
| Line 1: | Line 1: | ||
{{tip|The basic canvas.draw library was merged into FGDATA in 03/2020 so it available by default now. }} | {{tip|The basic canvas.draw library was merged into FGDATA in 03/2020 so it available by default now. }} | ||
{{Canvas Navigation}} | |||
== Introduction == | |||
= Introduction = | |||
There are basically two ways to populate a canvas, loading an SVG file which | There are basically two ways to populate a canvas, loading an SVG file which | ||
has been created with some tool like inkscape, or by writing a nasal program | has been created with some tool like inkscape, or by writing a nasal program | ||
| Line 12: | Line 12: | ||
to provide more drawing commands. | to provide more drawing commands. | ||
{{Note|Development of this library started in 12/2018 as a separate [[ | {{Note|Development of this library started in 12/2018 as a separate [[Addon|CanvasDrawDev add-on]] and is largely based on GPL'ed [[How to manipulate Canvas elements|plot2D code]] written originally by {{Usr|Rodolfo}} | ||
(rleibner on the forums) as part of the [[Spoken GCA]], [[PAR instrument]] and [[Oscilloscope addon|Oscilloscope]] add-ons.}} | (rleibner on the forums) as part of the [[Spoken GCA]], [[PAR instrument]] and [[Oscilloscope addon|Oscilloscope]] add-ons.}} | ||
== Goals == | === Goals === | ||
* Make the code flexible and powerful so people will like to use it | * Make the code flexible and powerful so people will like to use it | ||
* Provide complex drawing commands needed for e.g. compass rose or speed tapes | * Provide complex drawing commands needed for e.g. compass rose or speed tapes | ||
* Provide easy to use styles | * Provide easy to use styles | ||
= canvas.draw API = | == canvas.draw API == | ||
== draw module == | === draw module === | ||
{{note|All draw methods expect a canvas group element 'cgroup' as first parameter to draw on.}} | {{note|All draw methods expect a canvas group element 'cgroup' as first parameter to draw on.}} | ||
=== draw.colors === | ==== draw.colors ==== | ||
A hash with some standard colors like white, black, red, green, blue, cyan, magenta, yellow, orange. | A hash with some standard colors like white, black, red, green, blue, cyan, magenta, yellow, orange. | ||
Just in case you need them ;) | Just in case you need them ;) | ||
=== circle() === | ==== circle() ==== | ||
circle(cgroup, radius, center_x = nil, center_y = nil) | circle(cgroup, radius, center_x = nil, center_y = nil) | ||
| Line 35: | Line 35: | ||
'''center_x''', '''center_y''' optional center of circle | '''center_x''', '''center_y''' optional center of circle | ||
=== ellipse() === | ==== ellipse() ==== | ||
ellipse(cgroup, radius, center_x = nil, center_y = nil) | ellipse(cgroup, radius, center_x = nil, center_y = nil) | ||
| Line 42: | Line 42: | ||
'''center_x''', '''center_y''' optional center of ellipse | '''center_x''', '''center_y''' optional center of ellipse | ||
=== arc() === | ==== arc() ==== | ||
[[File:Canvas-draw-scales03.png|thumb|circular marks]] | [[File:Canvas-draw-scales03.png|thumb|circular marks]] | ||
arc(cgroup, radius, center, from_deg = nil, to_deg = nil) | arc(cgroup, radius, center, from_deg = nil, to_deg = nil) | ||
| Line 62: | Line 62: | ||
</syntaxhighlight> | </syntaxhighlight> | ||
=== rectange() === | ==== rectange() ==== | ||
rectangle(cgroup, width, height, x = 0, y = 0, rounded = nil) | rectangle(cgroup, width, height, x = 0, y = 0, rounded = nil) | ||
| Line 71: | Line 71: | ||
'''rounded''' optional radius of corners in pixel | '''rounded''' optional radius of corners in pixel | ||
=== square() === | ==== square() ==== | ||
square(cgroup, length, center_x = 0, center_y = 0, cfg = nil) | square(cgroup, length, center_x = 0, center_y = 0, cfg = nil) | ||
shorthand for rectangle with width = height = length | shorthand for rectangle with width = height = length | ||
=== deltoid() === | ==== deltoid() ==== | ||
[[File:Canvas-draw-shapes01.png|thumbnail|right]] | [[File:Canvas-draw-shapes01.png|thumbnail|right]] | ||
deltoid (cgroup, dx, dy1, dy2, x = 0, y = 0) | deltoid (cgroup, dx, dy1, dy2, x = 0, y = 0) | ||
| Line 113: | Line 113: | ||
</syntaxhighlight> | </syntaxhighlight> | ||
=== rhombus() / diamond() === | ==== rhombus() / diamond() ==== | ||
rhombus: func(cgroup, dx, dy, center_x = 0, center_y = 0) | rhombus: func(cgroup, dx, dy, center_x = 0, center_y = 0) | ||
| Line 125: | Line 125: | ||
=== grid() === | ==== grid() ==== | ||
[[File:Canvas-draw-grids01.png|thumbnail|right]] | [[File:Canvas-draw-grids01.png|thumbnail|right]] | ||
Draw horizontal and verical lines. Two signatures are available | Draw horizontal and verical lines. Two signatures are available | ||
| Line 150: | Line 150: | ||
</syntaxhighlight> | </syntaxhighlight> | ||
== Marks == | === Marks === | ||
Marks can be used to create scales / gauges. | Marks can be used to create scales / gauges. | ||
=== marksLinear() === | ==== marksLinear() ==== | ||
[[File:Canvas-draw-scales01.png|thumb|linear marks (horizontal)|right]] | [[File:Canvas-draw-scales01.png|thumb|linear marks (horizontal)|right]] | ||
[[File:Canvas-draw-scales02.png|thumb|linear marks (vertical)|right]] | [[File:Canvas-draw-scales02.png|thumb|linear marks (vertical)|right]] | ||
| Line 197: | Line 197: | ||
</syntaxhighlight> | </syntaxhighlight> | ||
=== marksCircular() === | ==== marksCircular() ==== | ||
[[File:Canvas-draw-scales03.png|thumb|circular marks|right]] | [[File:Canvas-draw-scales03.png|thumb|circular marks|right]] | ||
marksCircular(cgroup, radius, interval, phi_start = 0, phi_stop = 360, style = nil) | marksCircular(cgroup, radius, interval, phi_start = 0, phi_stop = 360, style = nil) | ||
| Line 231: | Line 231: | ||
</syntaxhighlight> | </syntaxhighlight> | ||
== draw.style == | === draw.style === | ||
Base class for styles. | Base class for styles. | ||
== draw.marksStyle == | === draw.marksStyle === | ||
Parameter hash for drawing marks (see above). | Parameter hash for drawing marks (see above). | ||
=== new() === | ==== new() ==== | ||
Create a new style instance. | Create a new style instance. | ||
<syntaxhighlight lang="nasal"> | <syntaxhighlight lang="nasal"> | ||
| Line 243: | Line 243: | ||
</syntaxhighlight> | </syntaxhighlight> | ||
=== setMarkLength() === | ==== setMarkLength() ==== | ||
Set length of marker in %interval or %radius | Set length of marker in %interval or %radius | ||
=== setMarkOffset() === | ==== setMarkOffset() ==== | ||
Set alignment of markers. | Set alignment of markers. | ||
| Line 264: | Line 264: | ||
</syntaxhighlight> | </syntaxhighlight> | ||
=== setMarkWidth() === | ==== setMarkWidth() ==== | ||
Set line width in pixel. | Set line width in pixel. | ||
=== setSubdivisions() === | ==== setSubdivisions() ==== | ||
Set number of subdivisions (default = 0). | Set number of subdivisions (default = 0). | ||
=== setSubdivisionLength() === | ==== setSubdivisionLength() ==== | ||
Set length of subdivision marker in %marker_length | Set length of subdivision marker in %marker_length | ||
== transform module == | === transform module === | ||
The following methods are available to manipulate existing canvas elements. | The following methods are available to manipulate existing canvas elements. | ||
{{note|This chapter is a draft, see {{code|FGDATA/Nasal/canvas/draw/transform.nas}} for details }} | {{note|This chapter is a draft, see {{code|FGDATA/Nasal/canvas/draw/transform.nas}} for details }} | ||
{{note|All transform methods expect a canvas element as first parameter.}} | {{note|All transform methods expect a canvas element as first parameter.}} | ||
=== move() === | ==== move() ==== | ||
params: elem, dx, dy | params: elem, dx, dy | ||
===rotate() === | ==== rotate() ==== | ||
params: elem, deg, center | params: elem, deg, center | ||
=== flipX() === | ==== flipX() ==== | ||
params: elem, xaxis = 0 | params: elem, xaxis = 0 | ||
mirror element on x-axis | mirror element on x-axis | ||
=== flipY() === | ==== flipY() ==== | ||
params: elem, yaxis = 0 | params: elem, yaxis = 0 | ||
mirror element on y-axis | mirror element on y-axis | ||
=== alignX() === | ==== alignX() ==== | ||
Aligns the element, moving it horizontaly to ref. | Aligns the element, moving it horizontaly to ref. | ||
| Line 307: | Line 307: | ||
=== alignY() === | ==== alignY() ==== | ||
Aligns the element, moving it vertically to ref. | Aligns the element, moving it vertically to ref. | ||
| Line 321: | Line 321: | ||
=== rotate180() === | ==== rotate180() ==== | ||
params: elem, center = nil | params: elem, center = nil | ||
center as [x,y] in pixels, otherwise: rotate in place | center as [x,y] in pixels, otherwise: rotate in place | ||
=== scaleX() === | ==== scaleX() ==== | ||
Stretch element horizontally | Stretch element horizontally | ||
| Line 337: | Line 337: | ||
ref the relative point to keep inplace. May be 'left', 'center' or 'right'. | ref the relative point to keep inplace. May be 'left', 'center' or 'right'. | ||
=== scaleY() === | ==== scaleY() ==== | ||
strech element vertically | strech element vertically | ||
| Line 348: | Line 348: | ||
ref the relative point to keep inplace. May be 'top', 'center' or 'bottom'. | ref the relative point to keep inplace. May be 'top', 'center' or 'bottom'. | ||
=== resize() === | ==== resize() ==== | ||
params: | params: | ||
| Line 359: | Line 359: | ||
may be 'left-top', 'left-center', 'left-bottom', 'center-top', 'center-center', 'center-bottom', 'right-top', 'right-center', 'right-bottom'. | may be 'left-top', 'left-center', 'left-bottom', 'center-top', 'center-center', 'center-bottom', 'right-top', 'right-center', 'right-bottom'. | ||
= References = | == References == | ||
[[CompassRose]] is based on canvas draw. | [[CompassRose]] is based on canvas draw. | ||
{{Note|You can test, improve and play around with canvas.draw by downloading the [[ | {{Note|You can test, improve and play around with canvas.draw by downloading the [[Addon|CanvasDrawDev add-on]]. }} | ||
Revision as of 10:10, 12 July 2020
| Tip The basic canvas.draw library was merged into FGDATA in 03/2020 so it available by default now. |
| The FlightGear forum has a subforum related to: Canvas |
Introduction
There are basically two ways to populate a canvas, loading an SVG file which has been created with some tool like inkscape, or by writing a nasal program that calls drawing functions of the canvas API.
Both ways are valid and have their pros and cons.
The canvas API was quite limited, only a few basic commands were available, so canvas.draw library was created to provide more drawing commands.
| Note Development of this library started in 12/2018 as a separate CanvasDrawDev add-on and is largely based on GPL'ed plot2D code written originally by Rodolfo
(rleibner on the forums) as part of the Spoken GCA, PAR instrument and Oscilloscope add-ons. |
Goals
- Make the code flexible and powerful so people will like to use it
- Provide complex drawing commands needed for e.g. compass rose or speed tapes
- Provide easy to use styles
canvas.draw API
draw module
| Note All draw methods expect a canvas group element 'cgroup' as first parameter to draw on. |
draw.colors
A hash with some standard colors like white, black, red, green, blue, cyan, magenta, yellow, orange. Just in case you need them ;)
circle()
circle(cgroup, radius, center_x = nil, center_y = nil)
radius in pixel
center_x, center_y optional center of circle
ellipse()
ellipse(cgroup, radius, center_x = nil, center_y = nil)
radius_x, radius_y in pixel
center_x, center_y optional center of ellipse
arc()
arc(cgroup, radius, center, from_deg = nil, to_deg = nil)
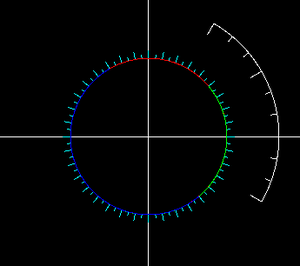
Draw an arc (part of a circle) with given radius around center. In the example image a red, green and blue arc are shown, nasal code below.
center center point of circle as vector [x,y]
from_deg, to_deg start and end of arc in degree of compass rose (0 = North, 90 = East, ...); defaults to 0, 360 (full circle)
    # [CX, CY] center point
    var start = -40;
    canvas.draw.arc(myGroup, radius, [CX, CY], start, start+190).setColor(COLORS["red"]);
    start += 90;
    canvas.draw.arc(myGroup, radius, [CX, CY], start, start+270).setColor(COLORS["green"]);
    start += 90;
    canvas.draw.arc(myGroup, radius, [CX, CY], start, start+190).setColor(COLORS["blue"]);
rectange()
rectangle(cgroup, width, height, x = 0, y = 0, rounded = nil)
width, height dimensions in pixels
x, y top-left corner of rectangle
rounded optional radius of corners in pixel
square()
square(cgroup, length, center_x = 0, center_y = 0, cfg = nil)
shorthand for rectangle with width = height = length
deltoid()
deltoid (cgroup, dx, dy1, dy2, x = 0, y = 0)
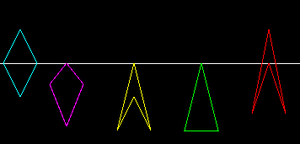
Deltoid draws a kite (dy1 > 0 and dy2 > 0) or a arrow head (dy2 < 0).
dx width
dy1 height of "upper" triangle
dy2 height of "lower" triangle, < 0 draws an arrow head
x, y position of tip
    var dx = 40;
    #rhombus draws around a center point while deltoid uses x,y for tip point
    shapes["rhombus1"] = canvas.draw.rhombus(group, dx, 2*dx, 5 + dx/2, CY)
        .setColor(COLORS["cyan"]);

    # width = 40, height = 25 + 50;
    shapes["deltoid1"] = canvas.draw.deltoid(group, dx, 25, 50, 2*dx, CY)
        .setColor(COLORS["magenta"]);

    # y2 < 0 results in arrow head
    canvas.draw.deltoid(group, dx, 2*dx, -dx, 4*dx, CY)
        .setColor(COLORS["yellow"]);

    # y2 = 0 results in triangle
    canvas.draw.deltoid(group, dx, 2*dx, 0, 6*dx, CY)
        .setColor(COLORS["green"]);

    # y2 < 0 and |y2| > y1 results in arrowhead with tip above baseline
    canvas.draw.deltoid(group, dx, 1.5*dx, -2.5*dx, 8*dx, CY)
        .setColor(COLORS["red"]);
rhombus() / diamond()
rhombus: func(cgroup, dx, dy, center_x = 0, center_y = 0)
draws a diamond around [center_x, center_y] (first element from left in sample image above)
dx width
dy height
grid()
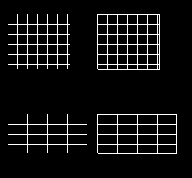
Draw horizontal and verical lines. Two signatures are available
1) (cgroup, [sizeX, sizeY], dx, dy, border = 1)
2) (cgroup, nx, ny, dx, dy, border = 1)
size [width, height] of grid in pixels.
nx, ny number of lines in x/y direction
dx, dy distance between lines in pixels.
border optional boolean, draw lines at sizeX and sizeY, true by default.
    var group = myRoot.createChild("group", "grid_scales");
    #-- grid test --
    canvas.draw.grid(group, [62, 55], 10, 10, 0).setTranslation(10, 100);
    canvas.draw.grid(group, [62, 55], 10, 10, 1).setTranslation(100, 100);
    canvas.draw.grid(group, 4, 4, 20, 10, 0).setTranslation(10, 200);
    canvas.draw.grid(group, 4, 4, 20, 10, 1).setTranslation(100, 200);
Marks
Marks can be used to create scales / gauges.
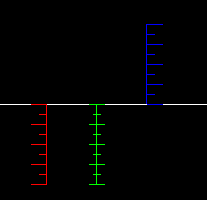
marksLinear()
marksLinear(cgroup, orientation, num_marks, interval, style)
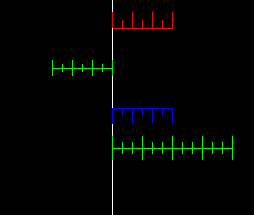
Draw marks for a linear scale on a canvas group, e.g. speed tape. Mark lines are draws perpendicular to baseline.
orientation of baseline, "up", "down" (="vertical"), "left", "right" (="horizontal"), only first character is evaluated (u,d,v,l,r,h).
num_marks number of marks to draw
interval distance between marks (pixel)
style marksStyle hash with more parameters
    #-- marks for linear scales --
    var group = myRoot.createChild("group", "marks");
    var style = canvas.draw.marksStyle.new()
        .setBaseline(1)
        .setMarkLength(0.8)     # 0.8 * interval
        .setSubdivisions(2);

    canvas.draw.marksLinear(group, "right", 5, 30, style).setTranslation(CX, 150)
        .setColor(COLORS["green"]);

    style.setSubdivisions(1);
    style.setMarkOffset(style.MARK_LEFT); # left/up
    canvas.draw.marksLinear(group, "v", 5, 20, style).setTranslation(50, CY)
        .setColor(COLORS["red"]);
    canvas.draw.marksLinear(group, "h", 4, 20, style).setTranslation(CX, 30)
        .setColor(COLORS["red"]);
    style.setMarkOffset(style.MARK_CENTER); #center
    canvas.draw.marksLinear(group, "down", 5, 20, style).setTranslation(100, CY)
        .setColor(COLORS["green"]);
    canvas.draw.marksLinear(group, "left", 4, 20, style).setTranslation(CX, 70)
        .setColor(COLORS["green"]);
    style.setMarkOffset(style.MARK_RIGHT); #right / down
    canvas.draw.marksLinear(group, "up", 5, 20, style).setTranslation(150, CY)
        .setColor(COLORS["blue"]);
    canvas.draw.marksLinear(group, "r", 4, 20, style).setTranslation(CX, 110)
        .setColor(COLORS["blue"]);
marksCircular()
marksCircular(cgroup, radius, interval, phi_start = 0, phi_stop = 360, style = nil)
draw marks along an arc or circle of given radius
radius of baseline (circle)
interval distance of marks in degree
phi_start position of first mark in degree (default 0 = north)
phi_stop position of last mark in degree (default 360)
    #-- marks on arc / circle --
    style.setMarkLength(0.1);
    style.setMarkOffset(style.MARK_IN); # pointing to center
    style.setSubdivisions(2);
    style.setBaseline(1);
    var radius = 150;
    var interval = 30;
    canvas.draw.marksCircular(group, radius, interval, 30, 120, style)
        .setTranslation(CX,CY);

    style.setMarkOffset(style.MARK_OUT); # pointing outside
    style.setSubdivisions(1);
    radius = 90;
    interval = 10;
    canvas.draw.marksCircular(group, radius, interval, 0, 360, style)
        .setTranslation(CX,CY)
        .setColor(COLORS["cyan"]);
draw.style
Base class for styles.
draw.marksStyle
Parameter hash for drawing marks (see above).
new()
Create a new style instance.
var myMarkStyle = canvas.draw.marksStyle.new()setMarkLength()
Set length of marker in %interval or %radius
setMarkOffset()
Set alignment of markers.
You can use marksStyle.MARK_LEFT marks left of vertical baseline
MARK_UP marks above horizontal baseline
MARK_CENTER marks centered on baseline
MARK_RIGHT marks right of vertical baseline
MARK_DOWN marks below horizontal baseline
var myMarkStyle = canvas.draw.marksStyle.new()
myMarkStyle.setMarkOffset(myMarkStyle.MARK_LEFT);
setMarkWidth()
Set line width in pixel.
setSubdivisions()
Set number of subdivisions (default = 0).
setSubdivisionLength()
Set length of subdivision marker in %marker_length
transform module
The following methods are available to manipulate existing canvas elements.
| Note This chapter is a draft, see FGDATA/Nasal/canvas/draw/transform.nas for details |
| Note All transform methods expect a canvas element as first parameter. |
move()
params: elem, dx, dy
rotate()
params: elem, deg, center
flipX()
params: elem, xaxis = 0
mirror element on x-axis
flipY()
params: elem, yaxis = 0
mirror element on y-axis
alignX()
Aligns the element, moving it horizontaly to ref.
params:
elem element to be moved.
ref reference may be an integer or another element.
alignment as string: may be 'left-left', 'left-center', 'left-right', 'center-left', 'center-center', 'center-right', 'right-left', 'right-center', 'right-right'. If ref is a single number, the 2nd word is ignored.
alignY()
Aligns the element, moving it vertically to ref.
params:
elem element to be moved.
ref reference may be an integer or another element.
alignment as string: may be 'top-top', 'top-center', 'top-bottom', 'center-top', 'center-center', 'center-bottom', 'bottom-top', 'bottom-center', 'bottom-bottom'. text elements also accept 'baseline' as reference. If ref is a single number, the 2nd word is ignored.
rotate180()
params: elem, center = nil
center as [x,y] in pixels, otherwise: rotate in place
scaleX()
Stretch element horizontally
params:
elem element to be stretched.
factor the new-width/old-width ratio.
ref the relative point to keep inplace. May be 'left', 'center' or 'right'.
scaleY()
strech element vertically
params:
elem element to be stretched.
factor the new-height/old-height ratio.
ref the relative point to keep inplace. May be 'top', 'center' or 'bottom'.
resize()
params:
elem element to be stretched.
factors as vector [Xfactor, Yfactor]
ref the relative point to keep inplace:
may be 'left-top', 'left-center', 'left-bottom', 'center-top', 'center-center', 'center-bottom', 'right-top', 'right-center', 'right-bottom'.
References
CompassRose is based on canvas draw.
| Note You can test, improve and play around with canvas.draw by downloading the CanvasDrawDev add-on. |
