Autopilot PID controller tuning resources: Difference between revisions
m (Robot: Cosmetic changes) |
|||
| Line 8: | Line 8: | ||
Knowing the algorithm is mandatory, certain values are forbidden, for example they can lead to a division by zero. Then you will have to understand where the parameters apply to act on the chosen correction module. See the schema which is a good reminder while testing. | Knowing the algorithm is mandatory, certain values are forbidden, for example they can lead to a division by zero. Then you will have to understand where the parameters apply to act on the chosen correction module. See the schema which is a good reminder while testing. | ||
[[ | [[File:pid_controler.png|thumb|PID parameter's application]] | ||
[[ | [[File:pid_cotroler_data_graph.png|thumb|Datas of an Auto-trim PID Controller displayed as graphs]] | ||
You can find good explanations on how to practically tune the controller. [http://en.wikipedia.org/wiki/PID_controller Wikipedia's article on the PID Controller] | You can find good explanations on how to practically tune the controller. [http://en.wikipedia.org/wiki/PID_controller Wikipedia's article on the PID Controller] | ||
| Line 64: | Line 64: | ||
</pre> | </pre> | ||
[[ | [[File:Live-graph-datafile-settings.png|thumb|Setting the Logfile input]] | ||
[[ | [[File:Livegraph-graph-settings.png|thumb|Setting the visuals]] | ||
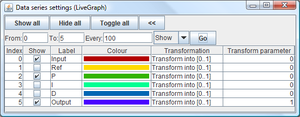
[[ | [[File:Livegraph-dataseries-settings.png|thumb|Finetuning the visuals]] | ||
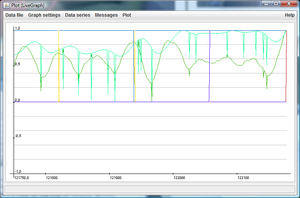
[[ | [[File:Livegraph-plot.png|thumb|Livegraph plotted data]] | ||
The first 4 lines prepare a kind of "header" in the Logfile so that the Grapher can use it. In the while-part I added the pipe sign as separator so that Live-Graph can use the output. Copy and paste these lines into your favorite ASCII text editor and save it to your FG directory (e.g. save as "fgfsparser.pl"). Next you need to install a Perl Interpreter (e.g. [http://www.activestate.com/activeperl Activestate's Active Perl]). Now start Flightgear the following way: | The first 4 lines prepare a kind of "header" in the Logfile so that the Grapher can use it. In the while-part I added the pipe sign as separator so that Live-Graph can use the output. Copy and paste these lines into your favorite ASCII text editor and save it to your FG directory (e.g. save as "fgfsparser.pl"). Next you need to install a Perl Interpreter (e.g. [http://www.activestate.com/activeperl Activestate's Active Perl]). Now start Flightgear the following way: | ||
| Line 79: | Line 79: | ||
After installing it start Live-Graph and set the Data file to your output logfile (e.g. "my_file"). Be aware that you don't have an output file before you did not start the process of debug output at least one time. In this case start Flight Gear first and activate the AP function on the autopilot where you activated the debug=true output. Back to Live-Graph: The update frequency works fine with updates at 1 Hz or 2 Hz (every 1 or 2 seconds). Activate "Show tail data" so that your graph will not be overcrowding during the time and keep caching data active or you will experience loss of data which will make your tests useless. | After installing it start Live-Graph and set the Data file to your output logfile (e.g. "my_file"). Be aware that you don't have an output file before you did not start the process of debug output at least one time. In this case start Flight Gear first and activate the AP function on the autopilot where you activated the debug=true output. Back to Live-Graph: The update frequency works fine with updates at 1 Hz or 2 Hz (every 1 or 2 seconds). Activate "Show tail data" so that your graph will not be overcrowding during the time and keep caching data active or you will experience loss of data which will make your tests useless. | ||
Next you need to define the visual output: set the viewport on the Y-axis from min. -1.5 to max. +1.5. Leaving the scaling to "auto" will create a graph which will not be very easy to read. X-axis set to auto on both sides. | Next you need to define the visual output: set the viewport on the Y-axis from min. -1.5 to max. +1.5. Leaving the scaling to "auto" will create a graph which will not be very easy to read. X-axis set to auto on both sides. It's quite handy to set the horizontal grid (I prefer a grid size of 0.2 to 0.5). And last but not least on X-Axis set "Dataset numbers" as type for the input. | ||
In the Data series window you can switch the single values on and off and define the way how the program should plot the data. Here in the image I acquire the data of a simple wing leveler and therefor I normalize all data to values between 0 and 1. Be aware that my settings are not mandatory. Be creative and play around with different settings until you feel satisfied with the plotted data. | In the Data series window you can switch the single values on and off and define the way how the program should plot the data. Here in the image I acquire the data of a simple wing leveler and therefor I normalize all data to values between 0 and 1. Be aware that my settings are not mandatory. Be creative and play around with different settings until you feel satisfied with the plotted data. | ||
| Line 88: | Line 88: | ||
To tune a controller you would typically display the setpoint property and the controlled property in the same graph. Another property that is interesting too look at is the actuating property, which can be for example the aileron control or the elevator control. | To tune a controller you would typically display the setpoint property and the controlled property in the same graph. Another property that is interesting too look at is the actuating property, which can be for example the aileron control or the elevator control. | ||
[[Category:Resource]] | [[Category:Resource]] | ||
Revision as of 20:52, 30 November 2010
The FlightGear Autopilot is a modular system based on PID controllers. Here are some tips to help tuning such a controller. There is lot of documentation all over the Internet about how to tune the parameters, having this you will have to figure out how the Flightgear PID controller implementation works.
First of all, have a look at the code where you will see the algorithm which is used for our autopilot. Checking existing autopilot configurations in Flightgear aircraft will also help.
There is actually a doc about filters in Flightgear documentation. Filters can be applied on input or ouput values, in other words, before and after the PID controller (execution).
FlightGear PID Controller
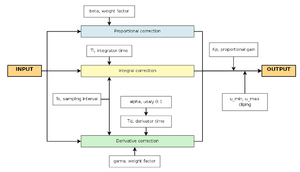
Knowing the algorithm is mandatory, certain values are forbidden, for example they can lead to a division by zero. Then you will have to understand where the parameters apply to act on the chosen correction module. See the schema which is a good reminder while testing.
You can find good explanations on how to practically tune the controller. Wikipedia's article on the PID Controller
Getting graphs of Controller action (Linux)
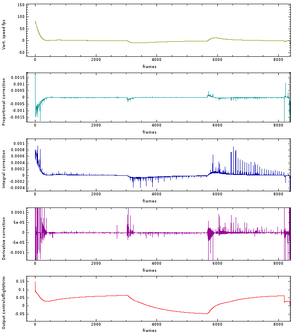
While it's possible to tune a PID controller by testing directly the aircraft behavior under the autopilot control, it can be really useful to get everything in graphical view.
First of all you'll have to turn the PID Controller's debug mode on. That is in the autopilot.xml you are working on. (I didn't try to turn on more than one PID controller's debugging support at the same time).
Then you will get 6 new values displayed on the console at each FG loop. You will need to catch them and format the values in one line. Here is an example of a parser script written in Perl:
#!/usr/bin/perl -w
# prints: "input reference P I D output"

while (<STDIN>) {
        if ($_ =~ /input\s=\s(-*\d+.*)\sref\s=\s(-*\d+.*)/) {
                print STDOUT "$1 $2 ";
        } elsif ($_ =~ /P:(-*\d+.*)\sI:(-*\d+.*)\sD:(-*\d+.*)/) {
                print STDOUT "$1 $2 $3";
        } elsif ($_ =~ /output\s=\s(.*)/) {
                print STDOUT " $1\n";
        }
}
Then you can write them in a file...
alexis@linear:~/fgfs$ /usr/local/bin/fgfs 2>&1 | ./PIDcontroller_parser.pl > my_file
If you use Linux, You can run Kst simultaneously to read the datas on the fly and watch them displayed together in real time while testing the aircraft.
Getting graphs of Controller action (Windows)
Under Windows the script of the Linux chapter works (with some minor modifications) together with Live-Graph under Windows, too. Although the output to a logfile is not as fluently as you may experience it under Linux. To get an output you first need a slightly modified version of the above mentioned Perl script:
if (<STDIN>) {
	print STDOUT "##|##\n";
	print STDOUT "Input|Ref|P|I|D|Output\n";
}
while (<STDIN>) {
	if ($_ =~ /input\s=\s(-*\d+.*)\sref\s=\s(-*\d+.*)/) {
		print STDOUT "$1|$2|";
	} elsif ($_ =~ /P:(-*\d+.*)\sI:(-*\d+.*)\sD:(-*\d+.*)/) {
		print STDOUT "$1|$2|$3";
	} elsif ($_ =~ /output\s=\s(.*)/) {
		print STDOUT "|$1\n";
	}
}
The first 4 lines prepare a kind of "header" in the Logfile so that the Grapher can use it. In the while-part I added the pipe sign as separator so that Live-Graph can use the output. Copy and paste these lines into your favorite ASCII text editor and save it to your FG directory (e.g. save as "fgfsparser.pl"). Next you need to install a Perl Interpreter (e.g. Activestate's Active Perl). Now start Flightgear the following way:
path-to-fgfs-binary\fgfs.exe | perl fgfsparser.pl > my_file 2&1
Feel free to prepare %fg-root%\preferences.xml to your desired needs if you plan to start at another location (instead of KSFO) or with another plane (instead of Cessna 172p) or if you want to change other options. As an alternative use the command line options to modify the start-up to your desired needs.
The following part describes the visualization of the debug output with Live Graph. Live-Graph is a GPL'd Graph Plotter for Windows systems available at Sourceforge.org.
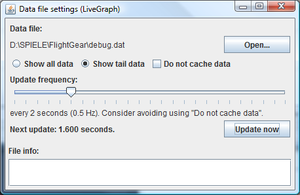
After installing it start Live-Graph and set the Data file to your output logfile (e.g. "my_file"). Be aware that you don't have an output file before you did not start the process of debug output at least one time. In this case start Flight Gear first and activate the AP function on the autopilot where you activated the debug=true output. Back to Live-Graph: The update frequency works fine with updates at 1 Hz or 2 Hz (every 1 or 2 seconds). Activate "Show tail data" so that your graph will not be overcrowding during the time and keep caching data active or you will experience loss of data which will make your tests useless.
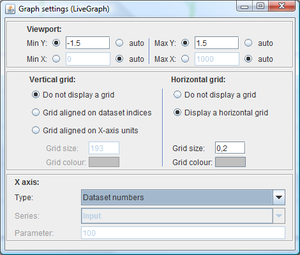
Next you need to define the visual output: set the viewport on the Y-axis from min. -1.5 to max. +1.5. Leaving the scaling to "auto" will create a graph which will not be very easy to read. X-axis set to auto on both sides. It's quite handy to set the horizontal grid (I prefer a grid size of 0.2 to 0.5). And last but not least on X-Axis set "Dataset numbers" as type for the input.
In the Data series window you can switch the single values on and off and define the way how the program should plot the data. Here in the image I acquire the data of a simple wing leveler and therefor I normalize all data to values between 0 and 1. Be aware that my settings are not mandatory. Be creative and play around with different settings until you feel satisfied with the plotted data. With "debug" in your AP.xml set to "true" you will now get the logfile filled and step by step the data will be visualized in Live-Graph. Now it's time to preset the autopilot to an initial value and to start the testing.
Alternative Method
As an alternative to using the controller's debug output you can use the built in logging system of Flight Gear. This can be configured through the preferences.xml file, or at runtime via the File->Logging menu option.
To tune a controller you would typically display the setpoint property and the controlled property in the same graph. Another property that is interesting too look at is the actuating property, which can be for example the aileron control or the elevator control.
